MetLife 2012 Annual Report Download - page 124
Download and view the complete annual report
Please find page 124 of the 2012 MetLife annual report below. You can navigate through the pages in the report by either clicking on the pages listed below, or by using the keyword search tool below to find specific information within the annual report.-
 1
1 -
2
-
3
-
4
-
5
-
6
-
7
-
8
-
9
-
10
-
11
-
12
-
13
-
14
-
15
-
16
-
17
-
18
-
19
-
20
-
21
-
22
-
23
-
24
-
25
-
26
-
27
-
28
-
29
-
30
-
31
-
32
-
33
-
34
-
35
-
36
-
37
-
38
-
39
-
40
-
41
-
42
-
43
-
44
-
45
-
46
-
47
-
48
-
49
-
50
-
51
-
52
-
53
-
54
-
55
-
56
-
57
-
58
-
59
-
60
-
61
-
62
-
63
-
64
-
65
-
66
-
67
-
68
-
69
-
70
-
71
-
72
-
73
-
74
-
75
-
76
-
77
-
78
-
79
-
80
-
81
-
82
-
83
-
84
-
85
-
86
-
87
-
88
-
89
-
90
-
91
-
92
-
93
-
94
-
95
-
96
-
97
-
98
-
99
-
100
-
101
-
102
-
103
-
104
-
105
-
106
-
107
-
108
-
109
-
110
-
111
-
112
-
113
-
 114
114 -
 115
115 -
 116
116 -
 117
117 -
 118
118 -
 119
119 -
 120
120 -
 121
121 -
 122
122 -
 123
123 -
 124
124 -
 125
125 -
 126
126 -
 127
127 -
 128
128 -
 129
129 -
 130
130 -
 131
131 -
 132
132 -
 133
133 -
 134
134 -
135
-
136
-
137
-
138
-
139
-
140
-
141
-
142
-
143
-
144
-
145
-
146
-
147
-
148
-
149
-
150
-
151
-
152
-
153
-
154
-
155
-
156
-
157
-
158
-
159
-
160
-
161
-
162
-
163
-
164
-
165
-
166
-
167
-
168
-
169
-
170
-
171
-
172
-
173
-
174
-
175
-
176
-
177
-
178
-
179
-
180
-
181
-
182
-
183
-
184
-
185
-
186
-
187
-
188
-
189
-
190
-
191
-
192
-
193
-
194
-
195
-
196
-
197
-
198
-
199
-
200
-
201
-
202
-
203
-
204
-
205
-
206
-
207
-
208
-
209
-
210
-
211
-
212
-
213
-
214
-
215
 |
 |

MetLife, Inc.
Notes to the Consolidated Financial Statements — (Continued)
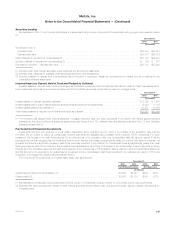
In periods subsequent to the recognition of OTTI on a fixed maturity security, the Company accounts for the impaired security as if it had been
purchased on the measurement date of the impairment. Accordingly, the discount (or reduced premium) based on the new cost basis is accreted
over the remaining term of the fixed maturity security in a prospective manner based on the amount and timing of estimated future cash flows.
Current Period Evaluation
Based on the Company’s current evaluation of its AFS securities in an unrealized loss position in accordance with its impairment policy, and the
Company’s current intentions and assessments (as applicable to the type of security) about holding, selling and any requirements to sell these
securities, the Company has concluded that these securities are not other-than-temporarily impaired at December 31, 2012. Future OTTI will depend
primarily on economic fundamentals, issuer performance (including changes in the present value of future cash flows expected to be collected),
changes in credit ratings, changes in collateral valuation, changes in interest rates and changes in credit spreads. If economic fundamentals or any of
the above factors deteriorate, additional OTTI may be incurred in upcoming periods.
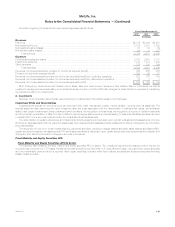
Gross unrealized losses on fixed maturity securities in an unrealized loss position decreased $3.8 billion during the year ended December 31,
2012 from $5.5 billion to $1.7 billion. The decline in, or improvement in, gross unrealized losses for the year ended December 31, 2012, was
primarily attributable to narrowing credit spreads and a decrease in interest rates.
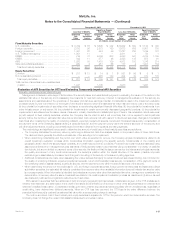
At December 31, 2012, $659 million of the total $1.7 billion of gross unrealized losses were from 183 fixed maturity securities with an unrealized
loss position of 20% or more of amortized cost for six months or greater.
Investment Grade Fixed Maturity Securities
Of the $659 million of gross unrealized losses on fixed maturity securities with an unrealized loss of 20% or more of amortized cost for six months
or greater, $299 million, or 45%, are related to gross unrealized losses on 74 investment grade fixed maturity securities. Unrealized losses on
investment grade fixed maturity securities are principally related to widening credit spreads or rising interest rates since purchase.
Below Investment Grade Fixed Maturity Securities
Of the $659 million of gross unrealized losses on fixed maturity securities with an unrealized loss of 20% or more of amortized cost for six months
or greater, $360 million, or 55%, are related to gross unrealized losses on 109 below investment grade fixed maturity securities. Unrealized losses on
below investment grade fixed maturity securities are principally related to non-agency RMBS (primarily alternative residential mortgage loans and sub-
prime residential mortgage loans), U.S and foreign corporate securities (primarily utility and financial services industry securities) and ABS (primarily
collateralized debt obligations) and are the result of significantly wider credit spreads resulting from higher risk premiums since purchase, largely due
to economic and market uncertainties including concerns over the financial services industry sector, unemployment levels and valuations of residential
real estate supporting non-agency RMBS. Management evaluates these U.S. and foreign corporate securities based on factors such as expected
cash flows and the financial condition and near-term and long-term prospects of the issuer; and evaluates non-agency RMBS and ABS based on
actual and projected cash flows after considering the quality of underlying collateral, expected prepayment speeds, current and forecasted loss
severity, consideration of the payment terms of the underlying assets backing a particular security, and the payment priority within the tranche
structure of the security.
Equity Securities
Equity securities in an unrealized loss position decreased $140 million during the year ended December 31, 2012 from $299 million to $159 million.
Of the $159 million, $119 million were from 13 equity securities with gross unrealized losses of 20% or more of cost for 12 months or greater, of which
87% were financial services industry investment grade non-redeemable preferred stock, of which 75% were rated A, AA, or AAA.
FVO and Trading Securities
See Note 10 for tables that present the four categories of securities that comprise FVO and trading securities. See “— Net Investment Income” and
“— Net Investment Gains (Losses)” for the net investment income recognized on FVO and trading securities and the related changes in estimated fair
value subsequent to purchase included in net investment income and net investment gains (losses) for securities still held as of the end of the
respective years, as applicable.
118 MetLife, Inc.