MetLife 2012 Annual Report Download - page 30
Download and view the complete annual report
Please find page 30 of the 2012 MetLife annual report below. You can navigate through the pages in the report by either clicking on the pages listed below, or by using the keyword search tool below to find specific information within the annual report.-
 1
1 -
2
-
3
-
4
-
5
-
6
-
7
-
8
-
9
-
10
-
11
-
12
-
13
-
14
-
15
-
16
-
17
-
18
-
19
-
 20
20 -
 21
21 -
 22
22 -
 23
23 -
 24
24 -
 25
25 -
 26
26 -
 27
27 -
 28
28 -
 29
29 -
 30
30 -
 31
31 -
 32
32 -
 33
33 -
 34
34 -
 35
35 -
 36
36 -
 37
37 -
 38
38 -
 39
39 -
 40
40 -
41
-
42
-
43
-
44
-
45
-
46
-
47
-
48
-
49
-
50
-
51
-
52
-
53
-
54
-
55
-
56
-
57
-
58
-
59
-
60
-
61
-
62
-
63
-
64
-
65
-
66
-
67
-
68
-
69
-
70
-
71
-
72
-
73
-
74
-
75
-
76
-
77
-
78
-
79
-
80
-
81
-
82
-
83
-
84
-
85
-
86
-
87
-
88
-
89
-
90
-
91
-
92
-
93
-
94
-
95
-
96
-
97
-
98
-
99
-
100
-
101
-
102
-
103
-
104
-
105
-
106
-
107
-
108
-
109
-
110
-
111
-
112
-
113
-
114
-
115
-
116
-
117
-
118
-
119
-
120
-
121
-
122
-
123
-
124
-
125
-
126
-
127
-
128
-
129
-
130
-
131
-
132
-
133
-
134
-
135
-
136
-
137
-
138
-
139
-
140
-
141
-
142
-
143
-
144
-
145
-
146
-
147
-
148
-
149
-
150
-
151
-
152
-
153
-
154
-
155
-
156
-
157
-
158
-
159
-
160
-
161
-
162
-
163
-
164
-
165
-
166
-
167
-
168
-
169
-
170
-
171
-
172
-
173
-
174
-
175
-
176
-
177
-
178
-
179
-
180
-
181
-
182
-
183
-
184
-
185
-
186
-
187
-
188
-
189
-
190
-
191
-
192
-
193
-
194
-
195
-
196
-
197
-
198
-
199
-
200
-
201
-
202
-
203
-
204
-
205
-
206
-
207
-
208
-
209
-
210
-
211
-
212
-
213
-
214
-
215
 |
 |

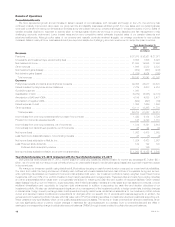
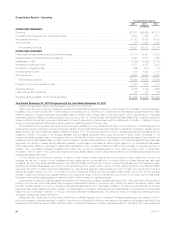
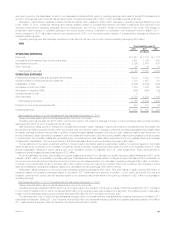
Consolidated Results – Operating
Years Ended December 31,
2012 2011 2010
(In millions)
OPERATING REVENUES
Premiums .................................................................................... $37,911 $36,269 $27,071
Universal life and investment-type product policy fees .................................................. 8,212 7,528 5,817
Net investment income .......................................................................... 20,472 19,638 16,855
Other revenues ................................................................................ 1,756 1,652 1,393
Total operating revenues ...................................................................... 68,351 65,087 51,136
OPERATING EXPENSES
Policyholder benefits and claims and policyholder dividends ............................................. 37,770 36,241 29,974
Interest credited to policyholder account balances .................................................... 6,242 6,057 4,697
Capitalization of DAC ........................................................................... (5,284) (5,549) (2,770)
Amortization of DAC and VOBA ................................................................... 4,177 4,355 2,443
Amortization of negative VOBA .................................................................... (555) (619) (57)
Interest expense on debt ........................................................................ 1,190 1,304 1,137
Other expenses ............................................................................... 16,680 16,620 10,602
Total operating expenses ...................................................................... 60,220 58,409 46,026
Provision for income tax expense (benefit) ........................................................... 2,323 1,879 1,414
Operating earnings ............................................................................. 5,808 4,799 3,696
Less: Preferred stock dividends ................................................................... 122 122 122
Operating earnings available to common shareholders ................................................. $ 5,686 $ 4,677 $ 3,574
Year Ended December 31, 2012 Compared with the Year Ended December 31, 2011
Unless otherwise stated, all amounts discussed below are net of income tax.
Higher policy fee income, stronger investment results and favorable claims experience were the primary drivers of the increase in operating earnings.
In addition, the prior year included a $117 million charge in connection with our use of the U.S. Social Security Administration’s Death Master File. These
positive impacts on operating earnings were partially offset by a $52 million charge taken in the first quarter of 2012 representing a multi–state
examination payment related to unclaimed property and our use of the U.S. Social Security Administration’s Death Master File to identify potential life
insurance claims, as well as the expected acceleration of benefit payments to policyholders under the settlements. In addition, changes in foreign
currency exchange rates had a $56 million negative impact on results compared to the prior year.
We benefited from strong sales, as well as growth and higher persistency in our business across many of our products. In our Retail segment, we
implemented extensive changes to product pricing and variable annuity guarantee features which resulted in a significant decrease in variable annuity
sales. However, as a result of stronger sales of variable annuities in 2011, we experienced growth in both our average separate account assets and our
investment portfolio. The growth in the average separate account assets generated higher policy fee income of $384 million. The growth in our
investment portfolio generated higher net investment income of $384 million. Since many of our products are interest spread–based, the increase in net
investment income was partially offset by a $345 million increase in interest credited expense, most notably in the Corporate Benefit Funding and Asia
segments. The decline in variable annuity sales also resulted in a decrease in commissions, despite higher sales from our international businesses,
which was partially offset by a decrease in related DAC capitalization which, combined, resulted in a $122 million increase to operating earnings. In
addition, other non-variable expenses increased $310 million and our annuity business growth in 2011 was the primary driver of higher DAC
amortization of $175 million in the current year. Higher premiums partially offset by higher policyholder benefits in our international segments improved
operating earnings by $93 million.
The low interest rate environment continued to result in lower interest credited expense as we set interest credited rates lower on both new
business, as well as on certain in-force business with rate resets that are contractually tied to external indices or contain discretionary rate reset
provisions. The improving equity markets resulted in lower DAC amortization and higher fee income in our annuity business. Improved investment yields,
excluding the Divested Businesses, were driven by the repositioning of the Japan portfolio, growth in higher yielding portfolios in the Asia and EMEA
segments, the impact of inflation-indexed investments in the Latin America segment, higher derivatives income primarily from interest rate floors and
interest rate swaps entered into prior to the onset of the low interest rate environment, and increased private equity income from improving equity
markets. These improvements were partially offset by the unfavorable impact of the low interest rate environment on our fixed-income investments.
Changes in market factors discussed above resulted in a $441 million increase in operating earnings.
Lower severity of property & casualty catastrophe claims in the current year increased operating earnings by $105 million as a result of severe storm
activity in the prior year, which was greater than the impact of severe storm activity in the current year, primarily the result of Superstorm Sandy. Less
favorable mortality results in our Group, Voluntary & Worksite Benefits segment and unfavorable mortality in our Asia and Corporate Benefit Funding
segments, was partially offset by favorable mortality in our Retail segment. In addition, claims experience varied across our products with a net favorable
result driven by a decrease in claims in our Group, Voluntary & Worksite Benefits segment. The combined impact of mortality and claims experience
decreased operating earnings by $79 million.
Liability and DAC refinements in both periods, primarily from our Retail, Asia and Group, Voluntary & Worksite Benefits segments, resulted in a $190
million net increase in operating earnings. In addition, the prior period included $40 million of expenses incurred related to a liquidation plan filed by the
Department of Financial Services for ELNY and $39 million of insurance claims and operating expenses related to the March 2011 earthquake and
24 MetLife, Inc.