MetLife 2012 Annual Report Download - page 116
Download and view the complete annual report
Please find page 116 of the 2012 MetLife annual report below. You can navigate through the pages in the report by either clicking on the pages listed below, or by using the keyword search tool below to find specific information within the annual report.
MetLife, Inc.
Notes to the Consolidated Financial Statements — (Continued)
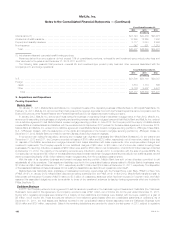
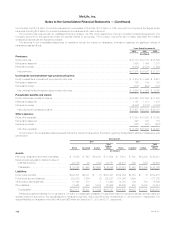
December 31,
2012 2011
(In millions)
Retail ................................................................................................. $11,500 $11,681
Group, Voluntary & Worksite Benefits ........................................................................ 382 377
Corporate Benefit Funding ................................................................................ 96 89
Latin America .......................................................................................... 1,231 1,050
Asia .................................................................................................. 9,554 9,554
EMEA ................................................................................................ 1,998 1,866
Corporate & Other ...................................................................................... — 2
Total ............................................................................................... $24,761 $24,619
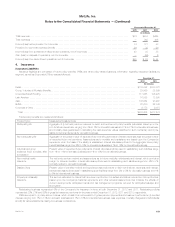
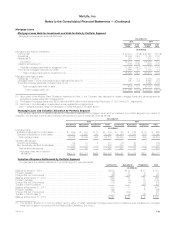
Information regarding other policy-related intangibles was as follows:
Years Ended December 31,
2012 2011 2010
(In millions)
Deferred Sales Inducements
Balance at January 1, .............................................................................. $ 926 $ 918 $ 841
Capitalization ..................................................................................... 81 140 157
Amortization ..................................................................................... (77) (132) (80)
Balance at December 31, ........................................................................... $ 930 $ 926 $ 918
VODA and VOCRA
Balance at January 1, .............................................................................. $1,264 $1,094 $ 792
Acquisitions ..................................................................................... — 213 356
Amortization (1) ................................................................................... (150) (60) (42)
Effect of foreign currency translation ................................................................... (6) 17 (12)
Balance at December 31, ........................................................................... $1,108 $1,264 $1,094
Accumulated amortization ........................................................................... $ 334 $ 184 $ 124
Negative VOBA
Balance at January 1, .............................................................................. $3,657 $4,287 $ —
Acquisitions ..................................................................................... 10 7 4,422
Amortization ..................................................................................... (622) (697) (64)
Effect of foreign currency translation ................................................................... (129) 60 (71)
Balance at December 31, ........................................................................... $2,916 $3,657 $4,287
Accumulated amortization ........................................................................... $1,383 $ 761 $ 64
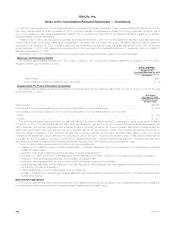
(1) In connection with the Company’s annual impairment testing of VOCRA, it was determined that the VOCRA included in the Group, Voluntary &
Worksite Benefits segment, associated with a previously acquired dental business, was impaired as the undiscounted future cash flows associated
with the asset were lower than its current carrying value. This shortfall in undiscounted future cash flows is primarily the result of actual persistency
experience being less favorable than what was assumed when the asset was acquired. As a result of this impairment, the Company wrote the
asset down to its estimated fair value, which was determined using the discounted cash flow valuation approach. The Company recorded a non-
cash charge of $77 million ($50 million, net of income tax) for the impairment of the VOCRA balance to other expenses in the consolidated
statement of operations for the year ended December 31, 2012.
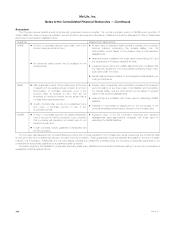
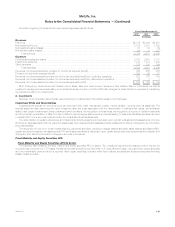
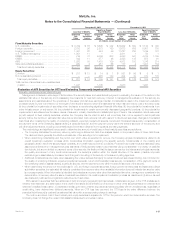
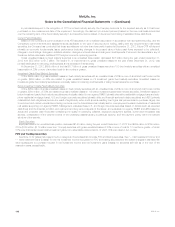
The estimated future amortization expense (credit) to be reported in other expenses for the next five years is as follows:
VOBA VODA and VOCRA Negative VOBA
(In millions)
2013 ................................................................ $ 1,048 $ 77 $ (521)
2014 ................................................................ $ 909 $ 80 $ (445)
2015 ................................................................ $ 763 $ 81 $ (364)
2016 ................................................................ $ 667 $ 77 $ (284)
2017 ................................................................ $ 574 $ 73 $ (166)
110 MetLife, Inc.


