MetLife 2012 Annual Report Download - page 47
Download and view the complete annual report
Please find page 47 of the 2012 MetLife annual report below. You can navigate through the pages in the report by either clicking on the pages listed below, or by using the keyword search tool below to find specific information within the annual report.-
 1
1 -
2
-
3
-
4
-
5
-
6
-
7
-
8
-
9
-
10
-
11
-
12
-
13
-
14
-
15
-
16
-
17
-
18
-
19
-
20
-
21
-
22
-
23
-
24
-
25
-
26
-
27
-
28
-
29
-
30
-
31
-
32
-
33
-
34
-
35
-
36
-
 37
37 -
 38
38 -
 39
39 -
 40
40 -
 41
41 -
 42
42 -
 43
43 -
 44
44 -
 45
45 -
 46
46 -
 47
47 -
 48
48 -
 49
49 -
 50
50 -
 51
51 -
 52
52 -
 53
53 -
 54
54 -
 55
55 -
 56
56 -
 57
57 -
58
-
59
-
60
-
61
-
62
-
63
-
64
-
65
-
66
-
67
-
68
-
69
-
70
-
71
-
72
-
73
-
74
-
75
-
76
-
77
-
78
-
79
-
80
-
81
-
82
-
83
-
84
-
85
-
86
-
87
-
88
-
89
-
90
-
91
-
92
-
93
-
94
-
95
-
96
-
97
-
98
-
99
-
100
-
101
-
102
-
103
-
104
-
105
-
106
-
107
-
108
-
109
-
110
-
111
-
112
-
113
-
114
-
115
-
116
-
117
-
118
-
119
-
120
-
121
-
122
-
123
-
124
-
125
-
126
-
127
-
128
-
129
-
130
-
131
-
132
-
133
-
134
-
135
-
136
-
137
-
138
-
139
-
140
-
141
-
142
-
143
-
144
-
145
-
146
-
147
-
148
-
149
-
150
-
151
-
152
-
153
-
154
-
155
-
156
-
157
-
158
-
159
-
160
-
161
-
162
-
163
-
164
-
165
-
166
-
167
-
168
-
169
-
170
-
171
-
172
-
173
-
174
-
175
-
176
-
177
-
178
-
179
-
180
-
181
-
182
-
183
-
184
-
185
-
186
-
187
-
188
-
189
-
190
-
191
-
192
-
193
-
194
-
195
-
196
-
197
-
198
-
199
-
200
-
201
-
202
-
203
-
204
-
205
-
206
-
207
-
208
-
209
-
210
-
211
-
212
-
213
-
214
-
215
 |
 |

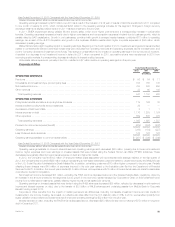
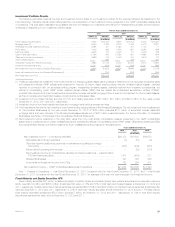
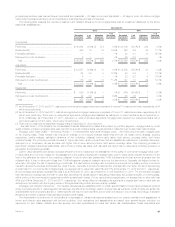
U.S. and Foreign Corporate Fixed Maturity Securities. We maintain a diversified portfolio of corporate fixed maturity securities across industries and
issuers. This portfolio does not have an exposure to any single issuer in excess of 1% of total investments and the top ten holdings comprise 2% of total
investments at both December 31, 2012 and 2011. The tables below present information for U.S. and foreign corporate securities at:
December 31,
2012 2011
Estimated
Fair
Value %of
Total
Estimated
Fair
Value %of
Total
(In millions) (In millions)
Corporate fixed maturity securities — by sector:
Foreign corporate(1) ................................................ $ 67,184 37.1% $ 64,018 37.7%
U.S. corporate fixed maturity securities — by industry: ........................
Consumer ........................................................ 29,852 16.4 26,739 15.7
Industrial ......................................................... 29,324 16.2 26,962 15.9
Finance .......................................................... 21,857 12.1 20,854 12.3
Utility ............................................................ 20,216 11.1 19,508 11.5
Communications ................................................... 9,084 5.0 8,178 4.8
Other ............................................................ 3,793 2.1 3,544 2.1
Total .......................................................... $181,310 100.0% $169,803 100.0%
(1) Includes both U.S. dollar and foreign denominated securities.
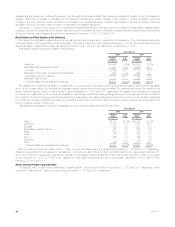
Structured Securities. We held $72.6 billion and $74.7 billion of structured securities, at estimated fair value, at December 31, 2012 and 2011,
respectively, as presented in the RMBS, CMBS and ABS sections below.
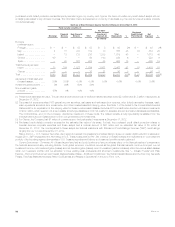
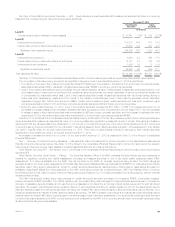
RMBS. The table below presents information about RMBS at:
December 31,
2012 2011
Estimated
Fair
Value %of
Total
Net
Unrealized
Gains (Losses)
Estimated
Fair
Value %of
Total
Net
Unrealized
Gains (Losses)
(In millions) (In millions) (In millions) (In millions)
By security type:
Collateralized mortgage obligations .......... $20,567 54.9% $ 889 $ 23,392 54.9% $ (341)
Pass-through securities ................... 16,912 45.1 924 19,245 45.1 886
Total RMBS .......................... $37,479 100.0% $ 1,813 $ 42,637 100.0% $ 545
By risk profile:
Agency ............................... $26,369 70.4% $ 1,944 $ 31,055 72.8% $ 2,074
Prime ................................. 4,206 11.2 101 5,959 14.0 (310)
Alt-A .................................. 4,950 13.2 (154) 4,648 10.9 (872)
Sub-prime ............................. 1,954 5.2 (78) 975 2.3 (347)
Total RMBS .......................... $37,479 100.0% $ 1,813 $ 42,637 100.0% $ 545
Ratings profile:
Rated Aaa/AAA ......................... $26,555 70.9% $ 31,690 74.3%
Rated NAIC 1 ........................... $32,377 86.4% $ 36,699 86.1%
Collateralized mortgage obligations are a type of mortgage-backed security structured by dividing the cash flows of mortgages into separate pools or
tranches of risk that create multiple classes of bonds with varying maturities and priority of payments. Pass-through mortgage-backed securities are a
type of asset-backed security that are secured by a mortgage or collection of mortgages. The monthly mortgage payments from homeowners pass
from the originating bank through an intermediary, such as a government agency or investment bank, which collects the payments and, for a fee, remits
or passes these payments through to the holders of the pass-through securities.
The majority of RMBS we hold are Agency RMBS. The majority of our RMBS holdings were rated Aaa/AAA by Moody’s, S&P or Fitch; and were
rated NAIC 1 by the NAIC at December 31, 2012 and 2011. Agency RMBS were guaranteed or otherwise supported by Federal National Mortgage
Association, Federal Home Loan Mortgage Corporation or GNMA. Non-agency RMBS include prime, Alt-A and sub-prime RMBS. Prime residential
mortgage lending includes the origination of residential mortgage loans to the most creditworthy borrowers with high quality credit profiles. Alt-Aisa
classification of mortgage loans where the risk profile of the borrower falls between prime and sub-prime. Sub-prime mortgage lending is the origination
of residential mortgage loans to borrowers with weak credit profiles. Included within prime and Alt-A RMBS are resecuritization of real estate mortgage
investment conduit (“Re-REMIC”) securities. Re-REMIC RMBS involve the pooling of previous issues of prime and Alt-A RMBS and restructuring the
combined pools to create new senior and subordinated securities. The credit enhancement on the senior tranches is improved through the
resecuritization.
At December 31, 2012 and 2011, our Alt-A securities portfolio had no exposure to option adjustable rate mortgages (“ARMs”) and a minimal
exposure to hybrid ARMs. Our Alt-A securities portfolio was comprised primarily of fixed rate mortgages (94% and 93% at December 31, 2012 and
2011, respectively) which have performed better than both option ARMs and hybrid ARMs in the overall Alt-A market.
MetLife, Inc. 41