MetLife 2012 Annual Report Download - page 58
Download and view the complete annual report
Please find page 58 of the 2012 MetLife annual report below. You can navigate through the pages in the report by either clicking on the pages listed below, or by using the keyword search tool below to find specific information within the annual report.-
 1
1 -
2
-
3
-
4
-
5
-
6
-
7
-
8
-
9
-
10
-
11
-
12
-
13
-
14
-
15
-
16
-
17
-
18
-
19
-
20
-
21
-
22
-
23
-
24
-
25
-
26
-
27
-
28
-
29
-
30
-
31
-
32
-
33
-
34
-
35
-
36
-
37
-
38
-
39
-
40
-
41
-
42
-
43
-
44
-
45
-
46
-
47
-
 48
48 -
 49
49 -
 50
50 -
 51
51 -
 52
52 -
 53
53 -
 54
54 -
 55
55 -
 56
56 -
 57
57 -
 58
58 -
 59
59 -
 60
60 -
 61
61 -
 62
62 -
 63
63 -
 64
64 -
 65
65 -
 66
66 -
 67
67 -
 68
68 -
69
-
70
-
71
-
72
-
73
-
74
-
75
-
76
-
77
-
78
-
79
-
80
-
81
-
82
-
83
-
84
-
85
-
86
-
87
-
88
-
89
-
90
-
91
-
92
-
93
-
94
-
95
-
96
-
97
-
98
-
99
-
100
-
101
-
102
-
103
-
104
-
105
-
106
-
107
-
108
-
109
-
110
-
111
-
112
-
113
-
114
-
115
-
116
-
117
-
118
-
119
-
120
-
121
-
122
-
123
-
124
-
125
-
126
-
127
-
128
-
129
-
130
-
131
-
132
-
133
-
134
-
135
-
136
-
137
-
138
-
139
-
140
-
141
-
142
-
143
-
144
-
145
-
146
-
147
-
148
-
149
-
150
-
151
-
152
-
153
-
154
-
155
-
156
-
157
-
158
-
159
-
160
-
161
-
162
-
163
-
164
-
165
-
166
-
167
-
168
-
169
-
170
-
171
-
172
-
173
-
174
-
175
-
176
-
177
-
178
-
179
-
180
-
181
-
182
-
183
-
184
-
185
-
186
-
187
-
188
-
189
-
190
-
191
-
192
-
193
-
194
-
195
-
196
-
197
-
198
-
199
-
200
-
201
-
202
-
203
-
204
-
205
-
206
-
207
-
208
-
209
-
210
-
211
-
212
-
213
-
214
-
215
 |
 |

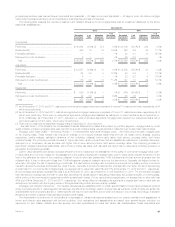
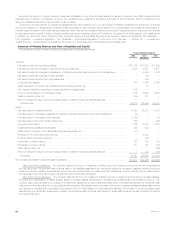
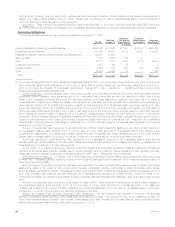
The table below contains the carrying value for guarantees at:
Future Policy Benefits Policyholder Account
Balances
December 31, December 31,
2012 2011 2012 2011
(In millions)
Americas:
GMDB .............................................................. $ 343 $ 249 $ — $ —
GMIB .............................................................. 1,432 723 200 988
GMAB .............................................................. — — 23 52
GMWB ............................................................. 30 19 428 710
Asia:
GMDB .............................................................. 54 58 — —
GMAB .............................................................. — — 11 11
GMWB ............................................................. 183 141 190 175
EMEA:
GMDB .............................................................. 6 4 — —
GMAB .............................................................. — — 28 168
GMWB ............................................................. 20 17 43 —
Corporate & Other:
GMDB .............................................................. 39 72 — —
GMAB .............................................................. — — 387 515
GMWB ............................................................. 95 30 2,195 1,825
Total ............................................................... $2,202 $1,313 $3,505 $4,444
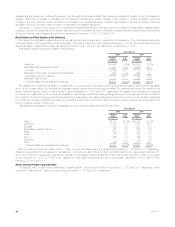
The carrying amounts for guarantees included in PABs above include nonperformance risk adjustments of $1.2 billion and $2.9 billion at
December 31, 2012 and December 31, 2011, respectively. These nonperformance risk adjustments represent the impact of including a credit spread
when discounting the underlying risk neutral cash flows to determine the estimated fair values. Therefore, the amount of the nonperformance risk
adjustment is a function of both the size of the economic liability and credit spreads. In certain periods, changes in the nonperformance risk adjustment
can be a significant driver of net derivative gains (losses). Additionally, changes in the underlying cash flows can have a greater impact on the
nonperformance risk adjustment than changes in credit spreads. The nonperformance risk adjustment does not have an economic impact on us as it
cannot be monetized given the nature of these policyholder liabilities. The change in valuation arising from the nonperformance risk adjustment is not
hedged.
The carrying values of these guarantees can change significantly during periods of sizable and sustained shifts in equity market performance, equity
volatility, interest rates or foreign currency exchange rates. Carrying values are also impacted by our assumptions around mortality, separate account
returns and policyholder behavior including lapse rates.
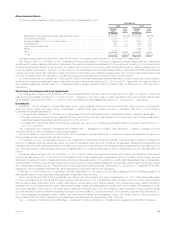
The above mentioned actuarial assumptions are updated periodically as credible experience emerges which shows variances from the current
assumptions. Where appropriate, these assumptions are consistent with those used in DAC amortization. See “— Summary of Critical Accounting
Estimates — Deferred Policy Acquisition Costs and Value of Business Acquired.” The significant impacts to variable annuity guarantees from this year’s
update were primarily related to the inputs for policyholder behavior and separate account returns. For policyholder behavior, the most significant update
was to our lapse assumptions which included an update to reflect how policyholder surrender behavior has responded to in-the-moneyness of the
guarantees. Actual experience for this update has only begun to emerge as surrender charge periods have recently started to expire. With respect to
separate account returns, which only impact liabilities included in future policy benefits, in our Retail segment we have lowered our long-term return
assumptions from 7.5% to 7.25% to reflect the impact of the sustained low interest rate environment on the fixed income portion of the separate
accounts. The effect of an increase (decrease) by 100 basis points in the assumed future rate of separate account returns in our Retail segment is
reasonably likely to result in a decrease (increase) in future policy benefits of approximately $300 million.
As discussed below, we use a combination of product design, reinsurance, hedging strategies, and other risk management actions to mitigate the
risks related to these benefits. Within each type of guarantee, there is a range of product offerings reflecting the changing nature of these products over
time. Changes in product features and terms are in part driven by customer demand but, more importantly, reflect our risk management practices of
continuously evaluating the guaranteed benefits and their associated asset-liability matching.
The sections below provide further detail by total contract account value for certain of our most popular guarantees. Total contract account values
include amounts not reported in the consolidated balance sheets from assumed reinsurance, contractholder-directed investments which do not qualify
for presentation as separate account assets, and amounts included in our general account.
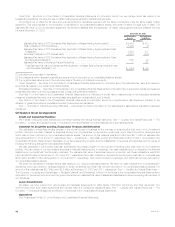
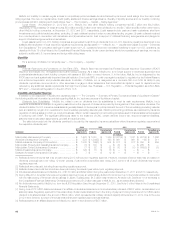
GMDB
We offer a range of GMDB to our contractholders. The table below presents GMDB, by benefit type, at December 31, 2012:
Total Contract
Account Value (1)
Americas Corporate
& Other
(In millions)
Return of premium or five to seven year step-up .............................................. $ 94,334 $17,300
Annual step-up ........................................................................ 28,590 —
Roll-up and step-up combination .......................................................... 35,135 —
Total ............................................................................... $158,059 $17,300
(1) Total contract account value above excludes $2.3 billion for contracts with no GMDB and approximately $11 billion of total contract account value in
the EMEA and Asia regions.
Based on total contract account value, less than 40% of our GMDB included enhanced death benefits such as the annual step-up or roll-up and
step-up combination products. We expect the above GMDB risk profile to be relatively consistent for the foreseeable future.
52 MetLife, Inc.