MetLife 2012 Annual Report Download - page 51
Download and view the complete annual report
Please find page 51 of the 2012 MetLife annual report below. You can navigate through the pages in the report by either clicking on the pages listed below, or by using the keyword search tool below to find specific information within the annual report.-
 1
1 -
2
-
3
-
4
-
5
-
6
-
7
-
8
-
9
-
10
-
11
-
12
-
13
-
14
-
15
-
16
-
17
-
18
-
19
-
20
-
21
-
22
-
23
-
24
-
25
-
26
-
27
-
28
-
29
-
30
-
31
-
32
-
33
-
34
-
35
-
36
-
37
-
38
-
39
-
40
-
 41
41 -
 42
42 -
 43
43 -
 44
44 -
 45
45 -
 46
46 -
 47
47 -
 48
48 -
 49
49 -
 50
50 -
 51
51 -
 52
52 -
 53
53 -
 54
54 -
 55
55 -
 56
56 -
 57
57 -
 58
58 -
 59
59 -
 60
60 -
 61
61 -
62
-
63
-
64
-
65
-
66
-
67
-
68
-
69
-
70
-
71
-
72
-
73
-
74
-
75
-
76
-
77
-
78
-
79
-
80
-
81
-
82
-
83
-
84
-
85
-
86
-
87
-
88
-
89
-
90
-
91
-
92
-
93
-
94
-
95
-
96
-
97
-
98
-
99
-
100
-
101
-
102
-
103
-
104
-
105
-
106
-
107
-
108
-
109
-
110
-
111
-
112
-
113
-
114
-
115
-
116
-
117
-
118
-
119
-
120
-
121
-
122
-
123
-
124
-
125
-
126
-
127
-
128
-
129
-
130
-
131
-
132
-
133
-
134
-
135
-
136
-
137
-
138
-
139
-
140
-
141
-
142
-
143
-
144
-
145
-
146
-
147
-
148
-
149
-
150
-
151
-
152
-
153
-
154
-
155
-
156
-
157
-
158
-
159
-
160
-
161
-
162
-
163
-
164
-
165
-
166
-
167
-
168
-
169
-
170
-
171
-
172
-
173
-
174
-
175
-
176
-
177
-
178
-
179
-
180
-
181
-
182
-
183
-
184
-
185
-
186
-
187
-
188
-
189
-
190
-
191
-
192
-
193
-
194
-
195
-
196
-
197
-
198
-
199
-
200
-
201
-
202
-
203
-
204
-
205
-
206
-
207
-
208
-
209
-
210
-
211
-
212
-
213
-
214
-
215
 |
 |

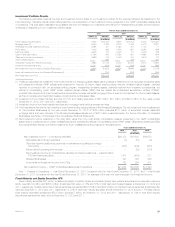
principal payments are past due as follows: commercial and residential — 60 days or more and agricultural — 90 days or more. We define mortgage
loans under foreclosure as loans in which foreclosure proceedings have formally commenced.
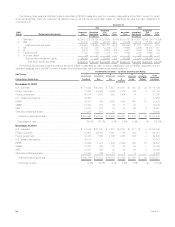
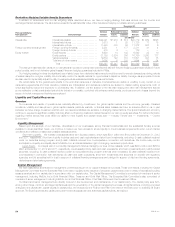
The following table presents the recorded investment and valuation allowance for all mortgage loans held-for-investment distributed by the above
stated loan classifications:
December 31,
2012 2011
Recorded
Investment %of
Total Valuation
Allowance
%of
Recorded
Investment Recorded
Investment %of
Total Valuation
Allowance
%of
Recorded
Investment
(In millions) (In millions) (In millions) (In millions)
Commercial:
Performing ..................................... $ 40,064 99.0% $ 214 0.5% $ 40,106 99.1% $ 339 0.8%
Restructured(1) .................................. 406 1.0 79 19.5% 248 0.6 44 17.7%
Potentially delinquent ............................. — — — —% 23 0.1 15 65.2%
Delinquent or under foreclosure ..................... 2 — — —% 63 0.2 — —%
Total ......................................... $ 40,472 100.0% $ 293 0.7% $ 40,440 100.0% $ 398 1.0%
Agricultural:
Performing ..................................... $ 12,657 98.6% $ 31 0.2% $ 12,899 98.3% $ 41 0.3%
Restructured(2) .................................. 64 0.5 8 12.5% 58 0.4 7 12.1%
Potentially delinquent ............................. 6 — — —% 25 0.2 4 16.0%
Delinquent or under foreclosure(2) ................... 116 0.9 13 11.2% 147 1.1 29 19.7%
Total ......................................... $ 12,843 100.0% $ 52 0.4% $ 13,129 100.0% $ 81 0.6%
Residential:
Performing ..................................... $ 929 97.0% $ — —% $ 664 96.4% $ 1 0.2%
Delinquent or under foreclosure(3) ................... 29 3.0 2 6.9% 25 3.6 1 4.0%
Total ......................................... $ 958 100.0% $ 2 0.2% $ 689 100.0% $ 2 0.3%
(1) As of December 31, 2012 and 2011, restructured commercial mortgage loans were comprised of nine and 10 restructured loans, respectively, all of
which were performing.
(2) As of December 31, 2012 and 2011, restructured agricultural mortgage loans were comprised of 15 and 11 restructured loans, respectively, all of
which were performing. There were no restructured agricultural mortgage loans classified as delinquent or under foreclosure as of December 31,
2012. Additionally, as of December 31, 2011, delinquent or under foreclosure agricultural mortgage loans included four restructured loans with a
recorded investment of $13 million, which were not performing.
(3) There were no restructured residential mortgage loans at December 31, 2012 and 2011.
See also Note 8 of the Notes to the Consolidated Financial Statements for tables that present, by portfolio segment, mortgage loans by credit
quality indicator, impaired mortgage loans, past due and nonaccrual mortgage loans, as well as loans modified through troubled debt restructurings.
Mortgage Loan Credit Quality — Monitoring Process — Commercial and Agricultural Mortgage Loans. We review all commercial mortgage loans
on an ongoing basis. These reviews may include an analysis of the property financial statements and rent roll, lease rollover analysis, property
inspections, market analysis, estimated valuations of the underlying collateral, loan-to-value ratios, debt service coverage ratios, and tenant
creditworthiness. The monitoring process focuses on higher risk loans, which include those that are classified as restructured, potentially delinquent,
delinquent or in foreclosure, as well as loans with higher loan-to-value ratios and lower debt service coverage ratios. The monitoring process for
agricultural mortgage loans is generally similar, with a focus on higher risk loans, such as loans with higher loan-to-value ratios, including reviews on a
geographic and property type basis.
Loan-to-value ratios and debt service coverage ratios are common measures in the assessment of the quality of commercial mortgage loans. Loan-
to-value ratios are a common measure in the assessment of the quality of agricultural mortgage loans. Loan-to-value ratios compare the amount of the
loan to the estimated fair value of the underlying collateral. A loan-to-value ratio greater than 100% indicates that the loan amount is greater than the
collateral value. A loan-to-value ratio of less than 100% indicates an excess of collateral value over the loan amount. Generally, the higher the loan-to-
value ratio, the higher the risk of experiencing a credit loss. The debt service coverage ratio compares a property’s net operating income to amounts
needed to service the principal and interest due under the loan. Generally, the lower the debt service coverage ratio, the higher the risk of experiencing
a credit loss. For our commercial mortgage loans, our average loan-to-value ratio was 57% and 61% at December 31, 2012 and 2011, respectively,
and our average debt service coverage ratio was 2.2x at December 31, 2012, as compared to 2.1x at December 31, 2011. The commercial mortgage
loan debt service coverage ratio and loan-to-value ratio, as well as the values utilized in calculating these ratios, are updated annually, on a rolling basis,
with a portion of the commercial mortgage loan portfolio updated each quarter. For our agricultural mortgage loans, our average loan-to-value ratio was
46% and 48% at December 31, 2012 and 2011, respectively. The values utilized in calculating the agricultural mortgage loan loan-to-value ratio are
developed in connection with the ongoing review of the agricultural loan portfolio and are routinely updated.
Mortgage Loan Valuation Allowances. Our valuation allowances are established both on a loan specific basis for those loans considered impaired
where a property specific or market specific risk has been identified that could likely result in a future loss, as well as for pools of loans with similar risk
characteristics where a property specific or market specific risk has not been identified, but for which we expect to incur a loss. Accordingly, a valuation
allowance is provided to absorb these estimated probable credit losses.
The determination of the amount of, and additions or decreases to, valuation allowances is based upon our periodic evaluation and assessment of
known and inherent risks associated with its loan portfolios. Such evaluations and assessments are based upon several factors, including our
experience for loan losses, defaults and loss severity, and loss expectations for loans with similar risk characteristics. These evaluations and
MetLife, Inc. 45