MetLife 2012 Annual Report Download - page 32
Download and view the complete annual report
Please find page 32 of the 2012 MetLife annual report below. You can navigate through the pages in the report by either clicking on the pages listed below, or by using the keyword search tool below to find specific information within the annual report.-
 1
1 -
2
-
3
-
4
-
5
-
6
-
7
-
8
-
9
-
10
-
11
-
12
-
13
-
14
-
15
-
16
-
17
-
18
-
19
-
20
-
21
-
 22
22 -
 23
23 -
 24
24 -
 25
25 -
 26
26 -
 27
27 -
 28
28 -
 29
29 -
 30
30 -
 31
31 -
 32
32 -
 33
33 -
 34
34 -
 35
35 -
 36
36 -
 37
37 -
 38
38 -
 39
39 -
 40
40 -
 41
41 -
 42
42 -
43
-
44
-
45
-
46
-
47
-
48
-
49
-
50
-
51
-
52
-
53
-
54
-
55
-
56
-
57
-
58
-
59
-
60
-
61
-
62
-
63
-
64
-
65
-
66
-
67
-
68
-
69
-
70
-
71
-
72
-
73
-
74
-
75
-
76
-
77
-
78
-
79
-
80
-
81
-
82
-
83
-
84
-
85
-
86
-
87
-
88
-
89
-
90
-
91
-
92
-
93
-
94
-
95
-
96
-
97
-
98
-
99
-
100
-
101
-
102
-
103
-
104
-
105
-
106
-
107
-
108
-
109
-
110
-
111
-
112
-
113
-
114
-
115
-
116
-
117
-
118
-
119
-
120
-
121
-
122
-
123
-
124
-
125
-
126
-
127
-
128
-
129
-
130
-
131
-
132
-
133
-
134
-
135
-
136
-
137
-
138
-
139
-
140
-
141
-
142
-
143
-
144
-
145
-
146
-
147
-
148
-
149
-
150
-
151
-
152
-
153
-
154
-
155
-
156
-
157
-
158
-
159
-
160
-
161
-
162
-
163
-
164
-
165
-
166
-
167
-
168
-
169
-
170
-
171
-
172
-
173
-
174
-
175
-
176
-
177
-
178
-
179
-
180
-
181
-
182
-
183
-
184
-
185
-
186
-
187
-
188
-
189
-
190
-
191
-
192
-
193
-
194
-
195
-
196
-
197
-
198
-
199
-
200
-
201
-
202
-
203
-
204
-
205
-
206
-
207
-
208
-
209
-
210
-
211
-
212
-
213
-
214
-
215
 |
 |

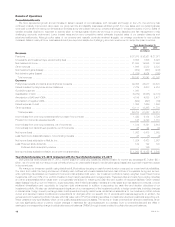
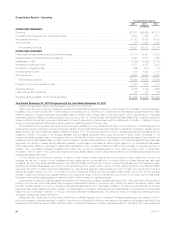
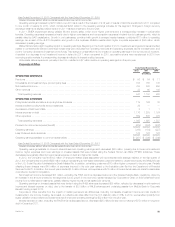
Segment Results and Corporate & Other
Retail
Years Ended December 31,
2012 2011 2010
(In millions)
OPERATING REVENUES
Premiums .................................................................................... $ 6,532 $ 6,711 $ 6,491
Universal life and investment-type product policy fees .................................................. 4,561 4,096 3,655
Net investment income .......................................................................... 7,670 7,414 7,644
Other revenues ................................................................................ 879 779 633
Total operating revenues ...................................................................... 19,642 19,000 18,423
OPERATING EXPENSES
Policyholder benefits and claims and policyholder dividends ............................................. 9,010 9,220 8,835
Interest credited to policyholder account balances .................................................... 2,375 2,412 2,381
Capitalization of DAC ........................................................................... (1,753) (2,339) (1,769)
Amortization of DAC and VOBA ................................................................... 1,607 1,845 1,724
Interest expense on debt ........................................................................ — 1 2
Other expenses ............................................................................... 5,369 5,854 5,059
Total operating expenses ...................................................................... 16,608 16,993 16,232
Provision for income tax expense (benefit) ........................................................... 1,032 672 735
Operating earnings ............................................................................. $ 2,002 $ 1,335 $ 1,456
Year Ended December 31, 2012 Compared with the Year Ended December 31, 2011
Unless otherwise stated, all amounts discussed below are net of income tax.
We implemented extensive changes to product pricing and variable annuity guarantee features as we continued to manage sales volume, focusing
on pricing discipline and risk management in this challenging economic environment. These actions resulted in a net decrease in the overall segment
sales in the current year, most notably a $10.7 billion, or 38% decrease in variable annuity sales which were $17.7 billion in 2012. Consistent with the
decrease in sales, retail life and annuity net flows were down $12.2 billion compared to the prior year.
Stronger sales of variable annuities in the prior year increased our average separate account assets and, as a result, generated higher asset-based
fee revenues, partially offset by increases in non-deferrable expenses, increases in guaranteed minimum death benefit liabilities and higher DAC
amortization related to the strong prior year sales. Positive net flows from life products, as well as higher allocated equity for annuities increased net
investment income. These positive net flows also contributed to higher DAC amortization. Business growth, mainly in our traditional life products,
generated higher interest credited expense; however, this was somewhat mitigated by a decrease in interest credited on deferred annuities where
normal surrenders and withdrawals were greater than sales for the year, resulting in negative net flows. In our property & casualty business, the increase
in average premium per policy in both auto and homeowners businesses improved operating earnings, but was partially offset by a decrease in
exposures. We experienced a decrease in exposures as the negative impact from lower premiums exceeded the positive impact from lower claims. The
net impact of these items resulted in a $198 million increase in operating earnings.
The improving equity market resulted in higher fee income from increased separate account balances, a decrease in variable annuity guaranteed
minimum death benefit liabilities and lower DAC amortization. In addition, the low interest rate environment continued to result in lower interest credited
expense, as we reduced interest credited rates on contracts with discretionary rate reset provisions. Higher derivatives income from interest rate floors
purchased prior to the onset of the low interest rate environment and higher returns on our private equity investments more than offset the decrease in
yields on other invested asset classes. The net impact of these items resulted in a $174 million increase in operating earnings.
In our property & casualty business, catastrophe-related losses decreased $74 million compared to 2011 mainly due to the severe storm activity
during the second and third quarters of 2011, which were greater than the impact of severe storm activity in the fourth quarter of 2012, primarily the
result of Superstorm Sandy. Current year non-catastrophe claim costs decreased $17 million as a result of lower claim frequencies in our homeowners
businesses. Higher severities in both our auto and homeowners business resulted in a $23 million increase in claims. The impact of this can be seen in
the favorable change in the combined ratio, including catastrophes, to 97.9% in 2012 from 107.3% in 2011. The combined ratio, excluding
catastrophes, was 85.8% in 2012, compared to 88.2% in the prior year. Favorable mortality experience in the traditional life business was partially offset
by unfavorable mortality experience in the variable and universal life and income annuities businesses resulting in a $21 million increase in operating
earnings. The current year results included a charge of $26 million for the expected acceleration of benefit payments to policyholders under a multi-state
examination related to unclaimed property. The prior year results included a charge of $28 million, in connection with the Company’s use of the U.S.
Social Security Administration’s Death Master File.
On an annual basis, we review and update our long-term assumptions used in our calculations of certain insurance-related liabilities and DAC. This
annual update resulted in a net operating earnings increase of $43 million. This favorable adjustment was primarily related to DAC unlockings in the
variable annuities business, partially offset by an increase in the liability for the secondary guarantees in the universal life business. In addition to our
annual updates, certain insurance-related liability and DAC refinements were recorded in both the current and prior year. The net impact of these
refinements was a $113 million increase in operating earnings. In our closed block, the impact of the dividend scale reduction, which was announced in
the fourth quarter of 2011, increased operating earnings by $19 million, net of DAC amortization.
26 MetLife, Inc.