MetLife 2012 Annual Report Download - page 53
Download and view the complete annual report
Please find page 53 of the 2012 MetLife annual report below. You can navigate through the pages in the report by either clicking on the pages listed below, or by using the keyword search tool below to find specific information within the annual report.-
 1
1 -
2
-
3
-
4
-
5
-
6
-
7
-
8
-
9
-
10
-
11
-
12
-
13
-
14
-
15
-
16
-
17
-
18
-
19
-
20
-
21
-
22
-
23
-
24
-
25
-
26
-
27
-
28
-
29
-
30
-
31
-
32
-
33
-
34
-
35
-
36
-
37
-
38
-
39
-
40
-
41
-
42
-
 43
43 -
 44
44 -
 45
45 -
 46
46 -
 47
47 -
 48
48 -
 49
49 -
 50
50 -
 51
51 -
 52
52 -
 53
53 -
 54
54 -
 55
55 -
 56
56 -
 57
57 -
 58
58 -
 59
59 -
 60
60 -
 61
61 -
 62
62 -
 63
63 -
64
-
65
-
66
-
67
-
68
-
69
-
70
-
71
-
72
-
73
-
74
-
75
-
76
-
77
-
78
-
79
-
80
-
81
-
82
-
83
-
84
-
85
-
86
-
87
-
88
-
89
-
90
-
91
-
92
-
93
-
94
-
95
-
96
-
97
-
98
-
99
-
100
-
101
-
102
-
103
-
104
-
105
-
106
-
107
-
108
-
109
-
110
-
111
-
112
-
113
-
114
-
115
-
116
-
117
-
118
-
119
-
120
-
121
-
122
-
123
-
124
-
125
-
126
-
127
-
128
-
129
-
130
-
131
-
132
-
133
-
134
-
135
-
136
-
137
-
138
-
139
-
140
-
141
-
142
-
143
-
144
-
145
-
146
-
147
-
148
-
149
-
150
-
151
-
152
-
153
-
154
-
155
-
156
-
157
-
158
-
159
-
160
-
161
-
162
-
163
-
164
-
165
-
166
-
167
-
168
-
169
-
170
-
171
-
172
-
173
-
174
-
175
-
176
-
177
-
178
-
179
-
180
-
181
-
182
-
183
-
184
-
185
-
186
-
187
-
188
-
189
-
190
-
191
-
192
-
193
-
194
-
195
-
196
-
197
-
198
-
199
-
200
-
201
-
202
-
203
-
204
-
205
-
206
-
207
-
208
-
209
-
210
-
211
-
212
-
213
-
214
-
215
 |
 |

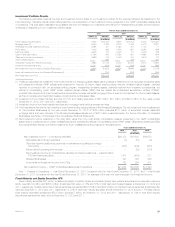
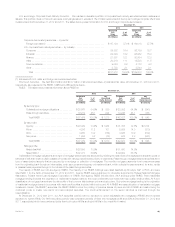
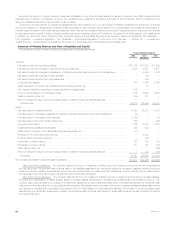
Other Invested Assets
The following table presents the carrying value of our other invested assets by type:
December 31,
2012 2011
Carrying
Value %of
Total Carrying
Value %of
Total
(In millions) (In millions)
Freestanding derivatives with positive estimated fair values ..................... $13,777 65.2% $ 16,200 68.7%
Tax credit partnerships ................................................ 2,268 10.7 1,531 6.5
Leveraged leases, net of non-recourse debt ................................ 1,998 9.4 2,248 9.5
Funds withheld ...................................................... 641 3.0 608 2.6
Joint venture investments .............................................. 180 0.9 171 0.7
MSRs .............................................................. — — 666 2.8
Other .............................................................. 2,281 10.8 2,157 9.2
Total ............................................................. $21,145 100.0% $ 23,581 100.0%
Leveraged lease impairments were $203 million and $4 million for the years ended December 31, 2012 and 2011, respectively.
See Notes 8 and 9 of the Notes to the Consolidated Financial Statements for information regarding leveraged leases and the freestanding
derivatives with positive estimated fair values, respectively. Tax credit partnerships are established for the purpose of investing in low-income housing
and other social causes, where the primary return on investment is in the form of income tax credits, and are accounted for under the equity method or
under the effective yield method. See Note 10 of the Notes to the Consolidated Financial Statements for activity rollforwards for MSRs. Funds withheld
represent amounts contractually withheld by ceding companies in accordance with reinsurance agreements. Joint venture investments are accounted
for under the equity method and represent our investment in insurance underwriting joint ventures in Chile, China and Korea.
Our private placement unit originated $8.1 billion and $8.8 billion of private investments, comprised primarily of certain privately placed fixed maturity
securities, tax credit partnerships and lease investments, during the years ended December 31, 2012 and 2011, respectively. The carrying value of
such private investments included within our consolidated balance sheets was $52.9 billion and $49.1 billion at December 31, 2012 and 2011,
respectively.
Short-term Investments and Cash Equivalents
The carrying value of short-term investments, which approximates estimated fair value, was $16.9 billion and $17.3 billion, or 3.2% and 3.3% of total
cash and invested assets, at December 31, 2012 and 2011, respectively. The carrying value of cash equivalents, which approximates estimated fair
value, was $6.1 billion and $5.0 billion, or 1.1% and 1.0% of total cash and invested assets, at December 31, 2012 and 2011, respectively.
Derivatives
Derivatives. We are exposed to various risks relating to its ongoing business operations, including interest rate, foreign currency exchange rate,
credit, and equity market. We use a variety of strategies to manage these risks, including the use of derivatives. See Note 9 of the Notes to
Consolidated Financial Statements for:
‰A comprehensive description of the nature of our derivatives, including the strategies for which derivatives are used in managing various risks.
‰Information about the notional amount, estimated fair value, and primary underlying risk exposure of our derivatives by type of hedge designation,
excluding embedded derivatives held at December 31, 2012 and 2011.
‰The statement of operations effects of derivatives in cash flow, fair value, or non-qualifying hedge relationships for the years ended December 31,
2012, 2011, and 2010.
See “Quantitative and Qualitative Disclosures About Market Risk — Management of Market Risk Exposures — Hedging Activities” for more
information about our use of derivatives by major hedge program.
Fair Value Hierarchy. See Note 10 of the Notes to the Consolidated Financial Statements for derivatives measured at estimated fair value on a
recurring basis and their corresponding fair value hierarchy.
The valuation of Level 3 derivatives involves the use of significant unobservable inputs and generally requires a higher degree of management
judgment or estimation than the valuations of Level 1 and Level 2 derivatives. Although Level 3 inputs are unobservable, management believes they are
consistent with what other market participants would use when pricing such instruments and are considered appropriate given the circumstances. The
use of different inputs or methodologies could have a material effect on the estimated fair value of Level 3 derivatives and could materially affect net
income.
Derivatives categorized as Level 3 at December 31, 2012 include: interest rate swaps and interest rate forwards with maturities which extend
beyond the observable portion of the yield curve; cancellable foreign currency swaps with unobservable currency correlation inputs; foreign currency
swaps and forwards with certain unobservable inputs, including unobservable portion of the yield curve; credit default swaps priced using unobservable
credit spreads, or that are priced through independent broker quotations; equity variance swaps with unobservable volatility inputs; and equity options
with unobservable correlation inputs or that are priced through independent broker quotations. At December 31, 2012 and 2011, less than 1% and 5%,
respectively, of the net derivative estimated fair value was priced through independent broker quotations.
See Note 10 of the Notes to the Consolidated Financial Statements for a rollforward of the fair value measurements for derivatives measured at
estimated fair value on a recurring basis using significant unobservable (Level 3) inputs.
Level 3 derivatives had a ($571) million gain/(loss) recognized in net income (loss) for the year ended December 31, 2012. This loss primarily relates
to certain purchased equity options that are valued using models dependent on an unobservable market correlation input and equity variance swaps
that are valued using observable equity volatility data plus an unobservable equity variance spread. The unobservable equity variance spread is
calculated from a comparison between broker offered variance swap volatility and observable plain vanilla equity option volatility. Other significant inputs,
which are observable, include equity index levels, equity volatility and the swap yield curve. We validate the reasonableness of these inputs by valuing
the positions using internal models and comparing the results to broker quotations. The primary drivers of the loss during the year ended December 31,
2012 were significant decreases in equity volatility, both historical and implied, and increases in equity index levels, which in total accounted for
approximately 79% of the loss. Changes in the unobservable inputs accounted for approximately 21% of the loss.
See “— Summary of Critical Accounting Estimates — Derivatives” for further information on the estimates and assumptions that affect derivatives.
MetLife, Inc. 47