MetLife 2012 Annual Report Download - page 145
Download and view the complete annual report
Please find page 145 of the 2012 MetLife annual report below. You can navigate through the pages in the report by either clicking on the pages listed below, or by using the keyword search tool below to find specific information within the annual report.-
 1
1 -
2
-
3
-
4
-
5
-
6
-
7
-
8
-
9
-
10
-
11
-
12
-
13
-
14
-
15
-
16
-
17
-
18
-
19
-
20
-
21
-
22
-
23
-
24
-
25
-
26
-
27
-
28
-
29
-
30
-
31
-
32
-
33
-
34
-
35
-
36
-
37
-
38
-
39
-
40
-
41
-
42
-
43
-
44
-
45
-
46
-
47
-
48
-
49
-
50
-
51
-
52
-
53
-
54
-
55
-
56
-
57
-
58
-
59
-
60
-
61
-
62
-
63
-
64
-
65
-
66
-
67
-
68
-
69
-
70
-
71
-
72
-
73
-
74
-
75
-
76
-
77
-
78
-
79
-
80
-
81
-
82
-
83
-
84
-
85
-
86
-
87
-
88
-
89
-
90
-
91
-
92
-
93
-
94
-
95
-
96
-
97
-
98
-
99
-
100
-
101
-
102
-
103
-
104
-
105
-
106
-
107
-
108
-
109
-
110
-
111
-
112
-
113
-
114
-
115
-
116
-
117
-
118
-
119
-
120
-
121
-
122
-
123
-
124
-
125
-
126
-
127
-
128
-
129
-
130
-
131
-
132
-
133
-
134
-
 135
135 -
 136
136 -
 137
137 -
 138
138 -
 139
139 -
 140
140 -
 141
141 -
 142
142 -
 143
143 -
 144
144 -
 145
145 -
 146
146 -
 147
147 -
 148
148 -
 149
149 -
 150
150 -
 151
151 -
 152
152 -
 153
153 -
 154
154 -
 155
155 -
156
-
157
-
158
-
159
-
160
-
161
-
162
-
163
-
164
-
165
-
166
-
167
-
168
-
169
-
170
-
171
-
172
-
173
-
174
-
175
-
176
-
177
-
178
-
179
-
180
-
181
-
182
-
183
-
184
-
185
-
186
-
187
-
188
-
189
-
190
-
191
-
192
-
193
-
194
-
195
-
196
-
197
-
198
-
199
-
200
-
201
-
202
-
203
-
204
-
205
-
206
-
207
-
208
-
209
-
210
-
211
-
212
-
213
-
214
-
215
 |
 |

MetLife, Inc.
Notes to the Consolidated Financial Statements — (Continued)
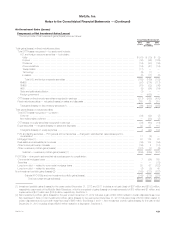
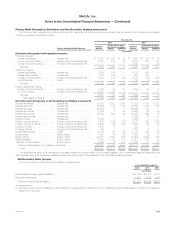
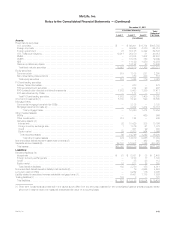
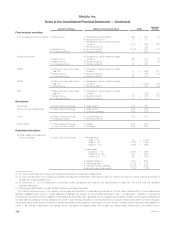
The following table presents the estimated fair value and balance sheet location of the Company’s embedded derivatives that have been separated
from their host contracts at:
December 31,
Balance Sheet Location 2012 2011
(In millions)
Net embedded derivatives within asset host contracts:
Ceded guaranteed minimum benefits .................... Premiums, reinsurance and other receivables $ 439 $ 327
Funds withheld on assumed reinsurance ................. Other invested assets 66 35
Options embedded in debt or equity securities ............. Investments (88) (70)
Other ............................................. Other invested assets 1 1
Net embedded derivatives within asset host contracts ......................................................... $ 418 $ 293
Net embedded derivatives within liability host contracts:
Direct guaranteed minimum benefits ..................... PABs $ 923 $2,104
Assumed guaranteed minimum benefits .................. PABs 2,582 2,340
Funds withheld on ceded reinsurance .................... Other liabilities 162 122
Other ............................................. PABs 17 18
Net embedded derivatives within liability host contracts ........................................................ $3,684 $4,584
The following table presents changes in estimated fair value related to embedded derivatives:
Years Ended December 31,
2012 2011 2010
(In millions)
Net derivative gains (losses) (1) ....................................................................... $1,239 $(1,284) $(387)
Policyholder benefits and claims ...................................................................... $ 75 $ 86 $ 8
(1) The valuation of guaranteed minimum benefits includes a nonperformance risk adjustment. The amounts included in net derivative gains (losses), in
connection with this adjustment, were ($1.7) billion, $1.8 billion and ($96) million for the years ended December 31, 2012, 2011 and 2010,
respectively.
10. Fair Value
When developing estimated fair values, the Company considers three broad valuation techniques: (i) the market approach, (ii) the income approach,
and (iii) the cost approach. The Company determines the most appropriate valuation technique to use, given what is being measured and the availability
of sufficient inputs, giving priority to observable inputs. The Company categorizes its assets and liabilities measured at estimated fair value into a three-
level hierarchy, based on the significant input with the lowest level in its valuation. The input levels are as follows:
Level 1 Unadjusted quoted prices in active markets for identical assets or liabilities. The Company defines active markets based on average trading
volume for equity securities. The size of the bid/ask spread is used as an indicator of market activity for fixed maturity securities.
Level 2 Quoted prices in markets that are not active or inputs that are observable either directly or indirectly. These inputs can include quoted
prices for similar assets or liabilities other than quoted prices in Level 1, quoted prices in markets that are not active, or other significant
inputs that are observable or can be derived principally from or corroborated by observable market data for substantially the full term of the
assets or liabilities.
Level 3 Unobservable inputs that are supported by little or no market activity and are significant to the determination of estimated fair value of the
assets or liabilities. Unobservable inputs reflect the reporting entity’s own assumptions about the assumptions that market participants
would use in pricing the asset or liability.
Financial markets are susceptible to severe events evidenced by rapid depreciation in asset values accompanied by a reduction in asset liquidity.
The Company’s ability to sell securities, or the price ultimately realized for these securities, depends upon the demand and liquidity in the market and
increases the use of judgment in determining the estimated fair value of certain securities.
Considerable judgment is often required in interpreting market data to develop estimates of fair value, and the use of different assumptions or
valuation methodologies may have a material effect on the estimated fair value amounts.
MetLife, Inc. 139