MetLife 2012 Annual Report Download - page 143
Download and view the complete annual report
Please find page 143 of the 2012 MetLife annual report below. You can navigate through the pages in the report by either clicking on the pages listed below, or by using the keyword search tool below to find specific information within the annual report.-
 1
1 -
2
-
3
-
4
-
5
-
6
-
7
-
8
-
9
-
10
-
11
-
12
-
13
-
14
-
15
-
16
-
17
-
18
-
19
-
20
-
21
-
22
-
23
-
24
-
25
-
26
-
27
-
28
-
29
-
30
-
31
-
32
-
33
-
34
-
35
-
36
-
37
-
38
-
39
-
40
-
41
-
42
-
43
-
44
-
45
-
46
-
47
-
48
-
49
-
50
-
51
-
52
-
53
-
54
-
55
-
56
-
57
-
58
-
59
-
60
-
61
-
62
-
63
-
64
-
65
-
66
-
67
-
68
-
69
-
70
-
71
-
72
-
73
-
74
-
75
-
76
-
77
-
78
-
79
-
80
-
81
-
82
-
83
-
84
-
85
-
86
-
87
-
88
-
89
-
90
-
91
-
92
-
93
-
94
-
95
-
96
-
97
-
98
-
99
-
100
-
101
-
102
-
103
-
104
-
105
-
106
-
107
-
108
-
109
-
110
-
111
-
112
-
113
-
114
-
115
-
116
-
117
-
118
-
119
-
120
-
121
-
122
-
123
-
124
-
125
-
126
-
127
-
128
-
129
-
130
-
131
-
132
-
 133
133 -
 134
134 -
 135
135 -
 136
136 -
 137
137 -
 138
138 -
 139
139 -
 140
140 -
 141
141 -
 142
142 -
 143
143 -
 144
144 -
 145
145 -
 146
146 -
 147
147 -
 148
148 -
 149
149 -
 150
150 -
 151
151 -
 152
152 -
 153
153 -
154
-
155
-
156
-
157
-
158
-
159
-
160
-
161
-
162
-
163
-
164
-
165
-
166
-
167
-
168
-
169
-
170
-
171
-
172
-
173
-
174
-
175
-
176
-
177
-
178
-
179
-
180
-
181
-
182
-
183
-
184
-
185
-
186
-
187
-
188
-
189
-
190
-
191
-
192
-
193
-
194
-
195
-
196
-
197
-
198
-
199
-
200
-
201
-
202
-
203
-
204
-
205
-
206
-
207
-
208
-
209
-
210
-
211
-
212
-
213
-
214
-
215
 |
 |

MetLife, Inc.
Notes to the Consolidated Financial Statements — (Continued)
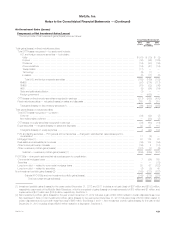
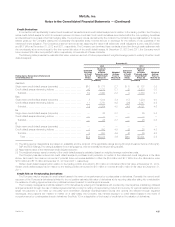
Credit Derivatives
In connection with synthetically created credit investment transactions and credit default swaps held in relation to the trading portfolio, the Company
writes credit default swaps for which it receives a premium to insure credit risk. Such credit derivatives are included within the non-qualifying derivatives
and derivatives for purposes other than hedging table. If a credit event occurs, as defined by the contract, the contract may be cash settled or it may be
settled gross by the Company paying the counterparty the specified swap notional amount in exchange for the delivery of par quantities of the
referenced credit obligation. The Company’s maximum amount at risk, assuming the value of all referenced credit obligations is zero, was $8.9 billion
and $7.7 billion at December 31, 2012 and 2011, respectively. The Company can terminate these contracts at any time through cash settlement with
the counterparty at an amount equal to the then current fair value of the credit default swaps. At December 31, 2012 and 2011, the Company would
have received $74 million and paid $41 million, respectively, to terminate all of these contracts.
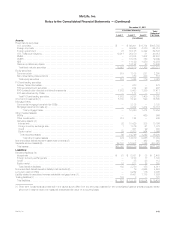
The following table presents the estimated fair value, maximum amount of future payments and weighted average years to maturity of written credit
default swaps at:
December 31,
2012 2011
Rating Agency Designation of Referenced
Credit Obligations (1)
Estimated
Fair Value
of Credit
Default
Swaps
Maximum
Amount
of Future
Payments under
Credit Default
Swaps (2)
Weighted
Average
Years to
Maturity (3)
Estimated
Fair Value
of Credit
Default
Swaps
Maximum
Amount
of Future
Payments under
Credit Default
Swaps (2)
Weighted
Average
Years to
Maturity (3)
(In millions) (In millions)
Aaa/Aa/A
Single name credit default swaps (corporate) ................... $10 $ 777 2.7 $ 5 $ 737 3.5
Credit default swaps referencing indices ...................... 42 2,713 2.1 (1) 2,813 3.0
Subtotal .............................................. 52 3,490 2.2 4 3,550 3.1
Baa
Single name credit default swaps (corporate) ................... 8 1,314 3.4 (17) 1,234 4.0
Credit default swaps referencing indices ...................... 11 3,750 4.9 (26) 2,847 4.9
Subtotal .............................................. 19 5,064 4.5 (43) 4,081 4.6
Ba
Single name credit default swaps (corporate) ................... — 25 2.7 — 25 3.5
Credit default swaps referencing indices ...................... — — — — — —
Subtotal .............................................. — 25 2.7 — 25 3.5
B
Single name credit default swaps (corporate) ................... — — — — — —
Credit default swaps referencing indices ...................... 3 300 4.9 (2) 25 4.8
Subtotal .............................................. 3 300 4.9 (2) 25 4.8
Total .............................................. $74 $8,879 3.6 $(41) $7,681 3.9
(1) The rating agency designations are based on availability and the midpoint of the applicable ratings among Moody’s Investors Service (“Moody’s”),
S&P and Fitch Ratings. If no rating is available from a rating agency, then an internally developed rating is used.
(2) Assumes the value of the referenced credit obligations is zero.
(3) The weighted average years to maturity of the credit default swaps is calculated based on weighted average notional amounts.
The Company has also entered into credit default swaps to purchase credit protection on certain of the referenced credit obligations in the table
above. As a result, the maximum amounts of potential future recoveries available to offset the $8.9 billion and $7.7 billion from the table above were
$150 million and $115 million at December 31, 2012 and 2011, respectively.
Written credit default swaps held in relation to the trading portfolio amounted to $10 million in notional and $0 in fair value at December 31, 2012.
Written credit default swaps held in relation to the trading portfolio amounted to $10 million in notional and ($1) million in fair value at December 31,
2011.
Credit Risk on Freestanding Derivatives
The Company may be exposed to credit-related losses in the event of nonperformance by counterparties to derivatives. Generally, the current credit
exposure of the Company’s derivatives is limited to the net positive estimated fair value of derivatives at the reporting date after taking into consideration
the existence of netting agreements and any collateral received pursuant to credit support annexes.
The Company manages its credit risk related to OTC derivatives by entering into transactions with creditworthy counterparties, maintaining collateral
arrangements and through the use of master agreements that provide for netting of payments by product and currency for periodic settlements and a
single net payment to be made by one party upon termination. Because exchange-traded futures and options are effected through regulated
exchanges, and positions are marked to market on a daily basis, the Company has minimal exposure to credit-related losses in the event of
nonperformance by counterparties to such derivatives. See Note 10 for a description of the impact of credit risk on the valuation of derivatives.
MetLife, Inc. 137