MetLife 2012 Annual Report Download - page 44
Download and view the complete annual report
Please find page 44 of the 2012 MetLife annual report below. You can navigate through the pages in the report by either clicking on the pages listed below, or by using the keyword search tool below to find specific information within the annual report.-
 1
1 -
2
-
3
-
4
-
5
-
6
-
7
-
8
-
9
-
10
-
11
-
12
-
13
-
14
-
15
-
16
-
17
-
18
-
19
-
20
-
21
-
22
-
23
-
24
-
25
-
26
-
27
-
28
-
29
-
30
-
31
-
32
-
33
-
 34
34 -
 35
35 -
 36
36 -
 37
37 -
 38
38 -
 39
39 -
 40
40 -
 41
41 -
 42
42 -
 43
43 -
 44
44 -
 45
45 -
 46
46 -
 47
47 -
 48
48 -
 49
49 -
 50
50 -
 51
51 -
 52
52 -
 53
53 -
 54
54 -
55
-
56
-
57
-
58
-
59
-
60
-
61
-
62
-
63
-
64
-
65
-
66
-
67
-
68
-
69
-
70
-
71
-
72
-
73
-
74
-
75
-
76
-
77
-
78
-
79
-
80
-
81
-
82
-
83
-
84
-
85
-
86
-
87
-
88
-
89
-
90
-
91
-
92
-
93
-
94
-
95
-
96
-
97
-
98
-
99
-
100
-
101
-
102
-
103
-
104
-
105
-
106
-
107
-
108
-
109
-
110
-
111
-
112
-
113
-
114
-
115
-
116
-
117
-
118
-
119
-
120
-
121
-
122
-
123
-
124
-
125
-
126
-
127
-
128
-
129
-
130
-
131
-
132
-
133
-
134
-
135
-
136
-
137
-
138
-
139
-
140
-
141
-
142
-
143
-
144
-
145
-
146
-
147
-
148
-
149
-
150
-
151
-
152
-
153
-
154
-
155
-
156
-
157
-
158
-
159
-
160
-
161
-
162
-
163
-
164
-
165
-
166
-
167
-
168
-
169
-
170
-
171
-
172
-
173
-
174
-
175
-
176
-
177
-
178
-
179
-
180
-
181
-
182
-
183
-
184
-
185
-
186
-
187
-
188
-
189
-
190
-
191
-
192
-
193
-
194
-
195
-
196
-
197
-
198
-
199
-
200
-
201
-
202
-
203
-
204
-
205
-
206
-
207
-
208
-
209
-
210
-
211
-
212
-
213
-
214
-
215
 |
 |
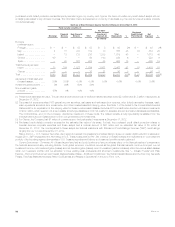
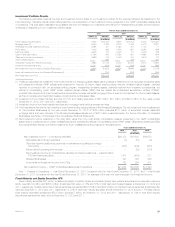
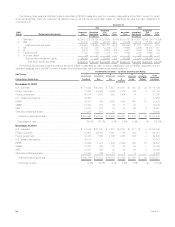
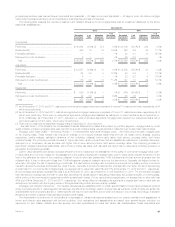
Equity securities AFS, which consisted principally of publicly traded and privately held common and non-redeemable preferred stocks, including
certain perpetual hybrid securities and mutual fund interests, were $2.9 billion and $3.0 billion at estimated fair value, or 0.5% and 0.6% of total cash
and invested assets, at December 31, 2012 and 2011, respectively. Publicly-traded equity securities represented $1.8 billion and $1.7 billion at
estimated fair value, or 62% and 57% of total equity securities, at December 31, 2012 and 2011, respectively. Privately-held equity securities
represented $1.1 billion and $1.3 billion at estimated fair value, or 38% and 43% of total equity securities, at December 31, 2012 and 2011,
respectively.
Included within fixed maturity and equity securities were $1.3 billion and $1.5 billion of perpetual securities, at estimated fair value, at December 31,
2012 and 2011, respectively. Upon acquisition, we classify perpetual securities that have attributes of both debt and equity as fixed maturity securities if
the securities have an interest rate step-up feature which, when combined with other qualitative factors, indicates that the securities have more debt-like
characteristics; while those with more equity-like characteristics are classified as equity securities. Many of such securities, commonly referred to as
“perpetual hybrid securities” have been issued by non-U.S. financial institutions that are accorded the highest two capital treatment categories by their
respective regulatory bodies (i.e. core capital, or “Tier 1 capital” and perpetual deferrable securities, or “Upper Tier 2 capital”).
Included within fixed maturity securities were $1.6 billion and $1.9 billion of redeemable preferred stock at estimated fair value at December 31,
2012 and 2011, respectively. These securities, which have stated maturity dates and cumulative interest deferral features, are commonly referred toas
“capital securities,” and are primarily issued by U.S. financial institutions.
Valuation of Securities. We are responsible for the determination of estimated fair value of our investments. We determine the estimated fair value
of publicly-traded securities after considering one of three primary sources of information: quoted market prices in active markets, independent pricing
services, or independent broker quotations; whereas for privately placed securities, estimated fair value is determined after considering one of three
primary sources of information: market standard internal matrix pricing, market standard internal discounted cash flow techniques, or independent pricing
services after we determine their use of available observable market data. For publicly-traded securities, the number of quotations obtained variesby
instrument and depends on the liquidity of the particular instrument. Generally, we obtain prices from multiple pricing services to cover all asset classes
and obtain multiple prices for certain securities, but ultimately utilize the price with the highest placement in the fair value hierarchy. Independent pricing
services that value these instruments use market standard valuation methodologies based on data about market transactions and inputs from multiple
pricing sources that are market observable or can be derived principally from or corroborated by observable market data. See Note 10 of the Notes to
the Consolidated Financial Statements for a discussion of the types of market standard valuation methodologies utilized and key assumptions and
observable inputs used in applying these standard valuation methodologies. When a price is not available in the active market or through an
independent pricing service, management will value the security primarily using market standard internal matrix pricing or discounted cash flow
techniques, and non-binding quotations from independent brokers who are knowledgeable about these securities. Independent non-binding broker
quotations utilize inputs that may be difficult to corroborate with observable market data. As shown in the following section, less than 1% of our fixed
maturity securities were valued using non-binding quotations from independent brokers at December 31, 2012.
Senior management, independent of the trading and investing functions, is responsible for the oversight of control systems and valuation policies,
including reviewing and approving new transaction types and markets, for ensuring that observable market prices and market-based parameters are
used for valuation, wherever possible, and for determining that judgmental valuation adjustments, when applied, are based upon established policies
and are applied consistently over time. We review our valuation methodologies on an ongoing basis and revise when necessary based on changing
market conditions. We gain assurance on the overall reasonableness and consistent application of input assumptions, valuation methodologies and
compliance with accounting standards for fair value determination through our controls designed to ensure that the financial assets and financial liabilities
are appropriately valued and represent an exit price. We utilize several controls, including certain monthly controls, which include, but are not limited to,
analysis of portfolio returns to corresponding benchmark returns, comparing a sample of executed prices of securities sold to the fair value estimates,
comparing fair value estimates to management’s knowledge of the current market, reviewing the bid/ask spreads to assess activity, comparing prices
from multiple pricing sources, when available, reviewing independent auditor reports regarding the controls over valuation of securities employedby
independent pricing services, and ongoing due diligence to confirm that independent pricing services use market-based parameters for valuation. We
determine the observability of inputs used in estimated fair values received from independent pricing services or brokers by assessing whether these
inputs can be corroborated by observable market data.
We also apply a formal process to challenge any prices received from independent pricing services that are not considered representative of
estimated fair value. If we conclude that prices received from independent pricing services are not reflective of market activity or representative of
estimated fair value, we will seek independent non-binding broker quotes or use an internally developed valuation to override these prices. Our internally
developed valuations of current estimated fair value, which reflect our estimates of liquidity and nonperformance risks, compared with pricing received
from the independent pricing services, did not produce material differences for the vast majority of our fixed maturity securities portfolio. This is, in part,
because our internal estimates of liquidity and nonperformance risks are generally based on available market evidence and estimates used by other
market participants. In the absence of such market-based evidence, management’s best estimate is used. As a result, we generally use the price
provided by the independent pricing service under our normal pricing protocol.
We have reviewed the significance and observability of inputs used in the valuation methodologies to determine the appropriate fair value hierarchy
level for each of its securities. Based on the results of this review and investment class analyses, each instrument is categorized as Level 1, 2 or 3
based on the lowest level significant input to its valuation. See Note 10 of the Notes to the Consolidated Financial Statements for information regarding
the valuation techniques and inputs by level within the three level fair value hierarchy by major classes of invested assets.
38 MetLife, Inc.