MetLife 2012 Annual Report Download - page 24
Download and view the complete annual report
Please find page 24 of the 2012 MetLife annual report below. You can navigate through the pages in the report by either clicking on the pages listed below, or by using the keyword search tool below to find specific information within the annual report.-
 1
1 -
2
-
3
-
4
-
5
-
6
-
7
-
8
-
9
-
10
-
11
-
12
-
13
-
 14
14 -
 15
15 -
 16
16 -
 17
17 -
 18
18 -
 19
19 -
 20
20 -
 21
21 -
 22
22 -
 23
23 -
 24
24 -
 25
25 -
 26
26 -
 27
27 -
 28
28 -
 29
29 -
 30
30 -
 31
31 -
 32
32 -
 33
33 -
 34
34 -
35
-
36
-
37
-
38
-
39
-
40
-
41
-
42
-
43
-
44
-
45
-
46
-
47
-
48
-
49
-
50
-
51
-
52
-
53
-
54
-
55
-
56
-
57
-
58
-
59
-
60
-
61
-
62
-
63
-
64
-
65
-
66
-
67
-
68
-
69
-
70
-
71
-
72
-
73
-
74
-
75
-
76
-
77
-
78
-
79
-
80
-
81
-
82
-
83
-
84
-
85
-
86
-
87
-
88
-
89
-
90
-
91
-
92
-
93
-
94
-
95
-
96
-
97
-
98
-
99
-
100
-
101
-
102
-
103
-
104
-
105
-
106
-
107
-
108
-
109
-
110
-
111
-
112
-
113
-
114
-
115
-
116
-
117
-
118
-
119
-
120
-
121
-
122
-
123
-
124
-
125
-
126
-
127
-
128
-
129
-
130
-
131
-
132
-
133
-
134
-
135
-
136
-
137
-
138
-
139
-
140
-
141
-
142
-
143
-
144
-
145
-
146
-
147
-
148
-
149
-
150
-
151
-
152
-
153
-
154
-
155
-
156
-
157
-
158
-
159
-
160
-
161
-
162
-
163
-
164
-
165
-
166
-
167
-
168
-
169
-
170
-
171
-
172
-
173
-
174
-
175
-
176
-
177
-
178
-
179
-
180
-
181
-
182
-
183
-
184
-
185
-
186
-
187
-
188
-
189
-
190
-
191
-
192
-
193
-
194
-
195
-
196
-
197
-
198
-
199
-
200
-
201
-
202
-
203
-
204
-
205
-
206
-
207
-
208
-
209
-
210
-
211
-
212
-
213
-
214
-
215
 |
 |

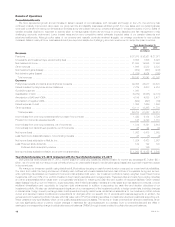
Results of Operations
Consolidated Results
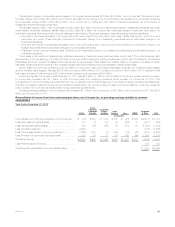
We have experienced growth and an increase in sales in several of our businesses, both domestic and foreign. In the U.S., the economy has
continued to slowly improve and, as a result, our group term life and disability businesses exhibited growth from new sales, and our dental business
continued to benefit from strong enrollments and renewals along with a large new group contract that began in the second quarter of 2012. Sales of
variable annuities declined in response to actions taken to manage sales volume as we focus on pricing discipline and risk management in this
challenging economic environment. Lower interest rates and a more competitive market adversely impacted sales of our pension closeouts and
structured settlements. Although policy sales of our property and casualty products remained sluggish, our average premiums for new policies
increased. Sales in nearly all of our businesses abroad have improved despite the challenging economic environment in certain European countries.
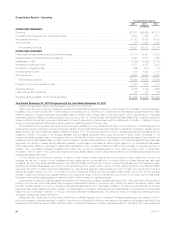
Years Ended December 31,
2012 2011 2010
(In millions)
Revenues
Premiums ...................................................................................... $37,975 $ 36,361 $ 27,071
Universal life and investment-type product policy fees .................................................... 8,556 7,806 6,028
Net investment income ............................................................................ 21,984 19,585 17,493
Other revenues .................................................................................. 1,906 2,532 2,328
Net investment gains (losses) ....................................................................... (352) (867) (408)
Net derivative gains (losses) ........................................................................ (1,919) 4,824 (265)
Total revenues ................................................................................ 68,150 70,241 52,247
Expenses
Policyholder benefits and claims and policyholder dividends ............................................... 39,356 36,917 30,672
Interest credited to policyholder account balances ...................................................... 7,729 5,603 4,919
Goodwill impairment .............................................................................. 1,868 – –
Capitalization of DAC ............................................................................. (5,289) (5,558) (2,770)
Amortization of DAC and VOBA ..................................................................... 4,199 4,898 2,477
Amortization of negative VOBA ...................................................................... (622) (697) (64)
Interest expense on debt .......................................................................... 1,356 1,629 1,550
Other expenses ................................................................................. 18,111 18,265 11,734
Total expenses ................................................................................ 66,708 61,057 48,518
Income (loss) from continuing operations before provision for income tax ..................................... 1,442 9,184 3,729
Provision for income tax expense (benefit) ............................................................. 128 2,793 1,110
Income (loss) from continuing operations, net of income tax ............................................... 1,314 6,391 2,619
Income (loss) from discontinued operations, net of income tax ............................................. 48 24 44
Net income (loss) ................................................................................ 1,362 6,415 2,663
Less: Net income (loss) attributable to noncontrolling interests ............................................. 38 (8) (4)
Net income (loss) attributable to MetLife, Inc. ........................................................... 1,324 6,423 2,667
Less: Preferred stock dividends ..................................................................... 122 122 122
Preferred stock redemption premium ............................................................ – 146 –
Net income (loss) available to MetLife, Inc.’s common shareholders ......................................... $ 1,202 $ 6,155 $ 2,545
Year Ended December 31, 2012 Compared with the Year Ended December 31, 2011
During the year ended December 31, 2012, income (loss) from continuing operations, before provision for income tax, decreased $7.7 billion ($5.1
billion, net of income tax) from the prior year primarily driven by an unfavorable change in net derivative gains (losses) and a goodwill impairment charge
in the current year.
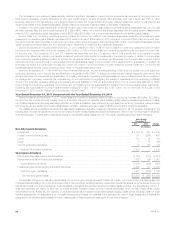
We manage our investment portfolio using disciplined ALM principles, focusing on cash flow and duration to support our current and future liabilities.
Our intent is to match the timing and amount of liability cash outflows with invested assets that have cash inflows of comparable timing and amount,
while optimizing risk-adjusted net investment income and risk-adjusted total return. Our investment portfolio is heavily weighted toward fixed income
investments, with over 80% of our portfolio invested in fixed maturity securities and mortgage loans. These securities and loans have varying maturities
and other characteristics which cause them to be generally well suited for matching the cash flow and duration of insurance liabilities. Other invested
asset classes including, but not limited to, equity securities, other limited partnership interests and real estate and real estate joint ventures, provide
additional diversification and opportunity for long-term yield enhancement in addition to supporting the cash flow and duration objectives of our
investment portfolio. We also use derivatives as an integral part of our management of the investment portfolio to hedge certain risks, including changes
in interest rates, foreign currency exchange rates, credit spreads and equity market levels. Additional considerations for our investment portfolio include
current and expected market conditions and expectations for changes within our specific mix of products and business segments. In addition, the
general account investment portfolio includes, within fair value option (“FVO”) and trading securities, contractholder-directed investments supporting unit-
linked variable annuity type liabilities, which do not qualify as separate account assets. The returns on these contractholder-directed investments, which
can vary significantly period to period, include changes in estimated fair value subsequent to purchase, inure to contractholders and are offset in
earnings by a corresponding change in policyholder account balances (“PABs”) through interest credited to policyholder account balances.
18 MetLife, Inc.