MetLife 2012 Annual Report Download - page 181
Download and view the complete annual report
Please find page 181 of the 2012 MetLife annual report below. You can navigate through the pages in the report by either clicking on the pages listed below, or by using the keyword search tool below to find specific information within the annual report.-
 1
1 -
2
-
3
-
4
-
5
-
6
-
7
-
8
-
9
-
10
-
11
-
12
-
13
-
14
-
15
-
16
-
17
-
18
-
19
-
20
-
21
-
22
-
23
-
24
-
25
-
26
-
27
-
28
-
29
-
30
-
31
-
32
-
33
-
34
-
35
-
36
-
37
-
38
-
39
-
40
-
41
-
42
-
43
-
44
-
45
-
46
-
47
-
48
-
49
-
50
-
51
-
52
-
53
-
54
-
55
-
56
-
57
-
58
-
59
-
60
-
61
-
62
-
63
-
64
-
65
-
66
-
67
-
68
-
69
-
70
-
71
-
72
-
73
-
74
-
75
-
76
-
77
-
78
-
79
-
80
-
81
-
82
-
83
-
84
-
85
-
86
-
87
-
88
-
89
-
90
-
91
-
92
-
93
-
94
-
95
-
96
-
97
-
98
-
99
-
100
-
101
-
102
-
103
-
104
-
105
-
106
-
107
-
108
-
109
-
110
-
111
-
112
-
113
-
114
-
115
-
116
-
117
-
118
-
119
-
120
-
121
-
122
-
123
-
124
-
125
-
126
-
127
-
128
-
129
-
130
-
131
-
132
-
133
-
134
-
135
-
136
-
137
-
138
-
139
-
140
-
141
-
142
-
143
-
144
-
145
-
146
-
147
-
148
-
149
-
150
-
151
-
152
-
153
-
154
-
155
-
156
-
157
-
158
-
159
-
160
-
161
-
162
-
163
-
164
-
165
-
166
-
167
-
168
-
169
-
170
-
 171
171 -
 172
172 -
 173
173 -
 174
174 -
 175
175 -
 176
176 -
 177
177 -
 178
178 -
 179
179 -
 180
180 -
 181
181 -
 182
182 -
 183
183 -
 184
184 -
 185
185 -
 186
186 -
 187
187 -
 188
188 -
 189
189 -
 190
190 -
 191
191 -
192
-
193
-
194
-
195
-
196
-
197
-
198
-
199
-
200
-
201
-
202
-
203
-
204
-
205
-
206
-
207
-
208
-
209
-
210
-
211
-
212
-
213
-
214
-
215
 |
 |

MetLife, Inc.
Notes to the Consolidated Financial Statements — (Continued)
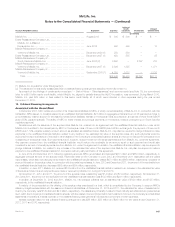
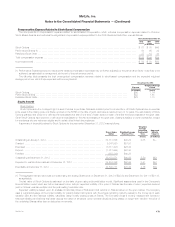
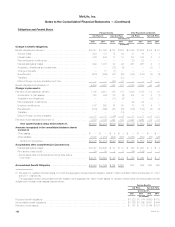
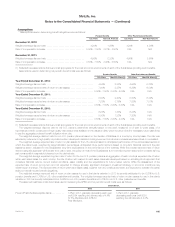
The following table presents a summary of Performance Share and Restricted Stock Unit activity for the year ended December 31, 2012:
Performance Shares Restricted Stock Units
Shares
Weighted Average
Grant Date
Fair Value Units
Weighted Average
Grant Date
Fair Value
Outstanding at January 1, 2012 .......................................... 5,024,094 $31.50 1,562,849 $34.74
Granted ............................................................. 2,042,133 $35.38 971,304 $35.39
Forfeited ............................................................ (452,590) $37.36 (171,475) $37.62
Payable (1) .......................................................... (1,791,609) $20.71 (282,530) $21.88
Outstanding at December 31, 2012 ....................................... 4,822,028 $36.93 2,080,148 $36.55
Expected to vest at a future date as of December 31, 2012 .................... 4,817,941 $36.98 2,080,148 $36.55
(1) Includes both Shares paid and Shares deferred for later payment.
Performance Share amounts above represent aggregate initial target awards and do not reflect potential increases or decreases resulting from the
performance factor determined after the end of the respective performance periods. At December 31, 2012, the three year performance period for the
2010 Performance Share grants was completed, but the performance factor had not yet been calculated. Included in the immediately preceding table
are 1,347,025 outstanding Performance Shares to which the 2010-2012 performance factor will be applied. The factor will be determined in the
second quarter of 2013.
Liability Awards (Phantom Stock-Based Awards)
Certain MetLife international subsidiaries have a liability for Phantom Stock-Based Awards in the form of Unit Options, Restricted Units, and
Performance Units. These Share-based cash settled awards are recorded as liabilities until payout is made. Unlike Share-settled awards, which have a
fixed grant-date fair value, the fair value of unsettled or unvested liability awards is remeasured at the end of each reporting period based on the change
in fair value of one Share. The liability and corresponding expense are adjusted accordingly until the award is settled.
Unit Options
Each Unit Option is the contingent right of the holders to receive a cash payment equal to the closing price of a Share on the surrender date, less
the closing price on the grant date, if the difference is greater than zero. The vast majority of Unit Options have become or will become eligible for
surrender at a rate of one-third of each award on each of the first three anniversaries of the grant date. Other Unit Options have become or will become
eligible for surrender on the third anniversary of the grant date. Vesting is subject to continued service, except for employees who are retirement eligible
and in certain other limited circumstances.
Restricted Units
Restricted Units are units that, if they vest, are payable in cash equal to the closing price of a Share on the last day of the restriction period. The vast
majority of Restricted Units normally vest in their entirety on the third anniversary of their grant date. Vesting is subject to continued service, except for
employees who are retirement eligible and in certain other limited circumstances.
Performance Units
Performance Units are units that, if they vest, are multiplied by a performance factor to produce a number of final Performance Units which are
payable in cash equal to the closing price of a Share on a date following the last day of the three-year performance period. Performance Units are
accounted for as liability awards, but are not credited with dividend-equivalents for actual dividends paid on Shares during the performance period.
Accordingly, the estimated fair value of Performance Units is based upon the closing price of a Share on the date of grant, reduced by the present value
of estimated dividends to be paid on that stock during the performance period.
See “— Performance Shares” for a discussion of the Performance Shares vesting period and award calculation, which is also used for Performance Units.
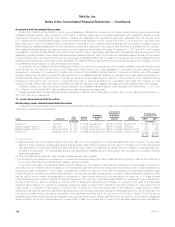
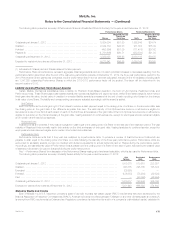
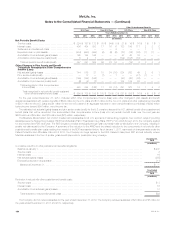
The following table presents a summary of Liability Award activity for the year ended December 31, 2012:
Unit
Options Restricted
Units Performance
Units
Outstanding at January 1, 2012 .......................................................... 1,083,370 510,681 233,257
Granted ............................................................................. 440,185 395,765 158,724
Exercised ............................................................................ (26,855) — —
Forfeited ............................................................................. (126,383) (75,930) (39,823)
Paid ................................................................................ — (90,080) (46,994)
Outstanding at December 31, 2012 ....................................................... 1,370,317 740,436 305,164
Expected to vest at a future date as of December 31, 2012 ..................................... 1,281,440 666,392 274,648
Statutory Equity and Income
Each of MetLife, Inc.’s U.S. insurance company’s state of domicile imposes risk-based capital (“RBC”) requirements that were developed by the
National Association of Insurance Commissioners (“NAIC”). American Life does not write business in Delaware or any other domestic state and, as such,
is exempt from RBC requirements by Delaware law. Regulatory compliance is determined by a ratio of a company’s total adjusted capital, calculated in
MetLife, Inc. 175