MetLife 2012 Annual Report Download - page 40
Download and view the complete annual report
Please find page 40 of the 2012 MetLife annual report below. You can navigate through the pages in the report by either clicking on the pages listed below, or by using the keyword search tool below to find specific information within the annual report.-
 1
1 -
2
-
3
-
4
-
5
-
6
-
7
-
8
-
9
-
10
-
11
-
12
-
13
-
14
-
15
-
16
-
17
-
18
-
19
-
20
-
21
-
22
-
23
-
24
-
25
-
26
-
27
-
28
-
29
-
 30
30 -
 31
31 -
 32
32 -
 33
33 -
 34
34 -
 35
35 -
 36
36 -
 37
37 -
 38
38 -
 39
39 -
 40
40 -
 41
41 -
 42
42 -
 43
43 -
 44
44 -
 45
45 -
 46
46 -
 47
47 -
 48
48 -
 49
49 -
 50
50 -
51
-
52
-
53
-
54
-
55
-
56
-
57
-
58
-
59
-
60
-
61
-
62
-
63
-
64
-
65
-
66
-
67
-
68
-
69
-
70
-
71
-
72
-
73
-
74
-
75
-
76
-
77
-
78
-
79
-
80
-
81
-
82
-
83
-
84
-
85
-
86
-
87
-
88
-
89
-
90
-
91
-
92
-
93
-
94
-
95
-
96
-
97
-
98
-
99
-
100
-
101
-
102
-
103
-
104
-
105
-
106
-
107
-
108
-
109
-
110
-
111
-
112
-
113
-
114
-
115
-
116
-
117
-
118
-
119
-
120
-
121
-
122
-
123
-
124
-
125
-
126
-
127
-
128
-
129
-
130
-
131
-
132
-
133
-
134
-
135
-
136
-
137
-
138
-
139
-
140
-
141
-
142
-
143
-
144
-
145
-
146
-
147
-
148
-
149
-
150
-
151
-
152
-
153
-
154
-
155
-
156
-
157
-
158
-
159
-
160
-
161
-
162
-
163
-
164
-
165
-
166
-
167
-
168
-
169
-
170
-
171
-
172
-
173
-
174
-
175
-
176
-
177
-
178
-
179
-
180
-
181
-
182
-
183
-
184
-
185
-
186
-
187
-
188
-
189
-
190
-
191
-
192
-
193
-
194
-
195
-
196
-
197
-
198
-
199
-
200
-
201
-
202
-
203
-
204
-
205
-
206
-
207
-
208
-
209
-
210
-
211
-
212
-
213
-
214
-
215
 |
 |

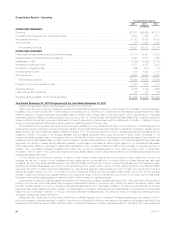
Year Ended December 31, 2011 Compared with the Year Ended December 31, 2010
Unless otherwise stated, all amounts discussed below are net of income tax.
MetLife, Inc. completed four debt financings in August 2010 in connection with the ALICO Acquisition, issuing $1.0 billion of 2.375% senior notes,
$1.0 billion of 4.75% senior notes, $750 million of 5.875% senior notes, and $250 million of floating rate senior notes. MetLife, Inc. also issued debt
securities in November 2010, which are part of the $3.0 billion stated value of common equity units. The proceeds from these debt issuances were
used to finance the ALICO Acquisition.
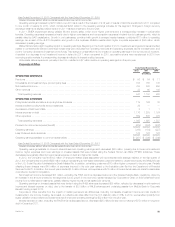
Operating earnings available to common shareholders and operating earnings each increased $43 million, primarily due to higher net investment income,
higher operating earnings on invested assets that were funded using the FHLB advances and higher tax credits. These increases were partially offset byan
increase in interest expense on debt of $81 million, primarily resulting from the 2010 debt issuances and an increase in other expenses. Lower earningsfrom
the assumed reinsurance of a variable annuity business and the resolutions of certain legal matters in 2010 also decreased operating earnings.
Net investment income, excluding the FHLB and assumed reinsurance which are discussed below and the divested MetLife Bank operations,
increased $105 million reflecting an increase of $125 million from higher yields, partially offset by a $20 million decrease from a decline in average
invested assets. Yields were primarily impacted by the decline in interest rates, resulting in lower crediting rates on the economic capital invested on the
segment’s behalf, partially offset by lower returns on our private equity and alternative investments. Our investments primarily include structured
securities, investment grade corporate fixed maturity securities, mortgage loans and U.S. Treasury and agency securities. In addition, our investment
portfolio includes the excess capital not allocated to the segments. Accordingly, it includes a higher allocation to certain other invested asset classes to
provide additional diversification and opportunity for long–term yield enhancement, including leveraged leases, other limited partnership interests, real
estate, real estate joint ventures, FVO and trading securities and equity securities.
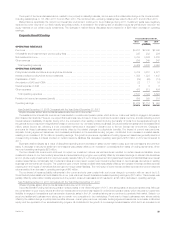
Operating earnings on invested assets that were funded using FHLB advances increased $20 million, reflected by increases in net investment
income and interest expense on debt, due to growth in long-term FHLB borrowings, primarily associated with growth in mortgages.
Corporate & Other benefits from the impact of certain permanent tax differences, including non-taxable investment income and tax credits for
investments in low income housing. As a result, our effective tax rates differ from the U.S. statutory rate of 35%. Corporate & Other benefited in 2011
from higher tax credits of $133 million over 2010 primarily due to $75 million of charges in 2010 related to the Health Care Act and higher utilization of
tax preferenced investments in 2011.
The Company incurred $40 million of expenses related to a liquidation plan filed by the Department of Financial Services for ELNY in the third quarter
of 2011. In addition, the Company had higher advertising costs of $15 million and internal resources costs for associates committed to the ALICO
Acquisition increased by $13 million. Minor fluctuations in various other expense categories, such as interest on uncertain tax positions, and
discretionary spending, such as consulting and postemployment related costs, offset each other and resulted in a small increase to earnings.
Additionally, the resolutions of certain legal matters in the prior period resulted in $39 million of lower operating earnings for 2011.
The earnings associated with the assumed reinsurance of certain variable annuity products from our former operating joint venture in Japan
decreased $35 million. This was primarily due to an increase in benefit liabilities resulting from lower returns in the underlying funds and lower net
investment income, partially offset by higher fee income due to business growth.
Effects of Inflation
Management believes that inflation has not had a material effect on the Company’s consolidated results of operations, except insofar as inflation may
affect interest rates.
An increase in inflation could affect our business in several ways. During inflationary periods, the value of fixed income investments falls which could
increase realized and unrealized losses. Inflation also increases expenses for labor and other materials, potentially putting pressure on profitability if such
costs cannot be passed through in our product prices. Inflation could also lead to increased costs for losses and loss adjustment expenses in certain of
our businesses, which could require us to adjust our pricing to reflect our expectations for future inflation. Prolonged and elevated inflation could
adversely affect the financial markets and the economy generally, and dispelling it may require governments to pursue a restrictive fiscal and monetary
policy, which could constrain overall economic activity, inhibit revenue growth and reduce the number of attractive investment opportunities.
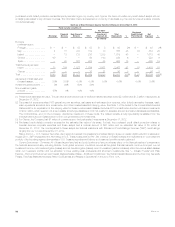
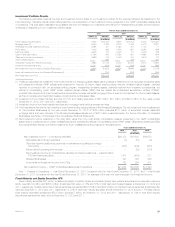
Investments
Investment Risks
Our primary investment objective is to optimize, net of income tax, risk-adjusted investment income and risk-adjusted total return while ensuring that
assets and liabilities are managed on a cash flow and duration basis. We are exposed to the following primary sources of investment risk:
‰credit risk, relating to the uncertainty associated with the continued ability of a given obligor to make timely payments of principal and interest;
‰interest rate risk, relating to the market price and cash flow variability associated with changes in market interest rates. Changes in market interest
rates can result from governmental monetary policies, domestic and international economic and political conditions, and other factors beyond our
control, and will impact the net unrealized gain or loss position of our fixed income investment portfolio and the rates of return we receive on both
new funds invested and reinvestment of existing funds.
‰liquidity risk, relating to the diminished ability to sell certain investments, in times of strained market conditions;
‰market valuation risk, relating to the variability in the estimated fair value of investments associated with changes in market factors such as credit
spreads. A widening of credit spreads will adversely impact the net unrealized gain (loss) position of the fixed income investment portfolio, will
increase losses associated with credit-based non-qualifying derivatives where we assume credit exposure, and, if credit spreads widen
significantly or for an extended period of time, will likely result in higher other-than-temporary impairments (“OTTI”). Credit spread tightening will
reduce net investment income associated with purchases of fixed maturity securities and will favorably impact the net unrealized gain (loss)
position of the fixed income investment portfolio.
‰currency risk, relating to the variability in currency exchange rates for foreign denominated investments. This risk relates to potential decreasesin
estimated fair value and income resulting from a strengthening or weakening in currency exchange rates versus the U.S. dollar. In general, the
weakening of foreign currencies versus the U.S. dollar will adversely affect the estimated fair value of our foreign denominated investments; and
‰real estate risk, relating to commercial and agricultural real estate, and stemming from factors, which include, but are not limited to, market
conditions including the demand and supply of leasable commercial space, creditworthiness of tenants and partners, capital markets volatility and
the inherent interest rate movement.
34 MetLife, Inc.