MetLife 2012 Annual Report Download - page 26
Download and view the complete annual report
Please find page 26 of the 2012 MetLife annual report below. You can navigate through the pages in the report by either clicking on the pages listed below, or by using the keyword search tool below to find specific information within the annual report.-
 1
1 -
2
-
3
-
4
-
5
-
6
-
7
-
8
-
9
-
10
-
11
-
12
-
13
-
14
-
15
-
 16
16 -
 17
17 -
 18
18 -
 19
19 -
 20
20 -
 21
21 -
 22
22 -
 23
23 -
 24
24 -
 25
25 -
 26
26 -
 27
27 -
 28
28 -
 29
29 -
 30
30 -
 31
31 -
 32
32 -
 33
33 -
 34
34 -
 35
35 -
 36
36 -
37
-
38
-
39
-
40
-
41
-
42
-
43
-
44
-
45
-
46
-
47
-
48
-
49
-
50
-
51
-
52
-
53
-
54
-
55
-
56
-
57
-
58
-
59
-
60
-
61
-
62
-
63
-
64
-
65
-
66
-
67
-
68
-
69
-
70
-
71
-
72
-
73
-
74
-
75
-
76
-
77
-
78
-
79
-
80
-
81
-
82
-
83
-
84
-
85
-
86
-
87
-
88
-
89
-
90
-
91
-
92
-
93
-
94
-
95
-
96
-
97
-
98
-
99
-
100
-
101
-
102
-
103
-
104
-
105
-
106
-
107
-
108
-
109
-
110
-
111
-
112
-
113
-
114
-
115
-
116
-
117
-
118
-
119
-
120
-
121
-
122
-
123
-
124
-
125
-
126
-
127
-
128
-
129
-
130
-
131
-
132
-
133
-
134
-
135
-
136
-
137
-
138
-
139
-
140
-
141
-
142
-
143
-
144
-
145
-
146
-
147
-
148
-
149
-
150
-
151
-
152
-
153
-
154
-
155
-
156
-
157
-
158
-
159
-
160
-
161
-
162
-
163
-
164
-
165
-
166
-
167
-
168
-
169
-
170
-
171
-
172
-
173
-
174
-
175
-
176
-
177
-
178
-
179
-
180
-
181
-
182
-
183
-
184
-
185
-
186
-
187
-
188
-
189
-
190
-
191
-
192
-
193
-
194
-
195
-
196
-
197
-
198
-
199
-
200
-
201
-
202
-
203
-
204
-
205
-
206
-
207
-
208
-
209
-
210
-
211
-
212
-
213
-
214
-
215
 |
 |

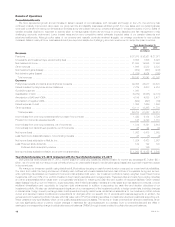
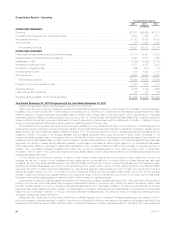
The decrease in net investment losses primarily reflects a significant decrease in current period impairments, as compared to the prior period on
fixed maturity securities, primarily attributable to prior year impairments on Greece sovereign debt securities, prior year intent-to-sell OTTI on other
sovereign debt due to the repositioning of the acquired ALICO portfolio into longer duration and higher yielding investments, and prior year intent-to-sell
impairments related to the Divested Businesses, partially offset by a decrease in gains on sales of real estate investments.
In addition, the current year includes a $1.9 billion ($1.6 billion, net of income tax) non-cash charge for goodwill impairment associated with our U.S. retail
annuities business. Also, the current year includes a $1.2 billion ($752 million, net of income tax) charge associated with the global review of assumptions
related to DAC, reserves and certain intangibles, of which $526 million ($342 million, net of income tax) was reflected in net derivative gains (losses).
Income (loss) from continuing operations, before provision for income tax, related to the Divested Businesses, excluding net investment gains
(losses) and net derivative gains (losses), decreased $724 million to a loss of $659 million in 2012 compared to income of $65 million in the prior year.
Included in this loss was a decrease in total revenues of $797 million and a decrease in total expenses of $73 million. The Divested Businesses include
certain operations of MetLife Bank and the Caribbean region, Panama and Costa Rica (the “Caribbean Business”).
Income tax expense for the year ended December 31, 2012 was $128 million, or 9% of income (loss) from continuing operations before provision
for income tax, compared with income tax expense of $2.8 billion, or 30% of income (loss) from continuing operations before provision for income tax,
for the prior year. The Company’s 2012 and 2011 effective tax rates differ from the U.S. statutory rate of 35% primarily due to the impact of certain
permanent tax differences, including non-taxable investment income and tax credits for investments in low income housing, in relation to income (loss)
from continuing operations before provision for income tax, as well as certain foreign permanent tax differences. The Company also recorded a $324
million tax benefit in the current year to reduce deferred income tax liabilities related to the conversion of the Japan branch to a subsidiary. In addition, as
previously mentioned, the current year includes a $1.9 billion ($1.6 billion, net of income tax) non-cash charge for goodwill impairment. The income tax
benefit associated with this charge is limited to $247 million on the associated tax goodwill.
As more fully described in “— Non-GAAP and Other Financial Disclosures,” we use operating earnings, which does not equate to income (loss) from
continuing operations, net of income tax, as determined in accordance with GAAP, to analyze our performance, evaluate segment performance, and
allocate resources. We believe that the presentation of operating earnings and operating earnings available to common shareholders, as we measure it
for management purposes, enhances the understanding of our performance by highlighting the results of operations and the underlying profitability
drivers of the business. Operating earnings and operating earnings available to common shareholders should not be viewed as substitutes for GAAP
income (loss) from continuing operations, net of income tax, and GAAP net income (loss) available to MetLife, Inc.’s common shareholders, respectively.
Operating earnings available to common shareholders increased $1.0 billion, net of income tax, to $5.7 billion, net of income tax, for the year ended
December 31, 2012 from $4.7 billion, net of income tax, in the prior year.
Year Ended December 31, 2011 Compared with the Year Ended December 31, 2010
During the year ended December 31, 2011, income (loss) from continuing operations, before provision for income tax, increased $5.5 billion ($3.8 billion,
net of income tax) over the prior year primarily driven by a favorable change in net derivative gains (losses), partially offset by increased net investment losses,
net of related adjustments, principally associated with DAC and VOBA amortization. Also included in income (loss) from continuing operations, before provision
for income tax, are the results of the Divested Businesses. In addition, operating earnings increased, reflecting the impact of the ALICO Acquisition.
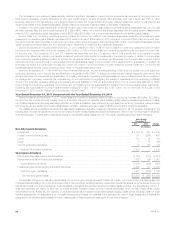
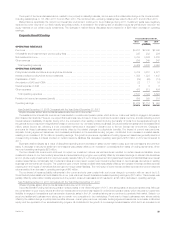
The variable annuity embedded derivatives and associated freestanding derivative hedges are collectively referred to as “VA program derivatives” in the
following table. All other derivatives that are economic hedges of certain invested assets and insurance liabilities are referred to as “non-VA program derivatives”
in the following table. The table below presents the impact on net derivative gains (losses) from non-VA program derivatives and VA program derivatives:
Years Ended
December 31,
Change2011 2010
(In millions)
Non-VA program derivatives
Interest rate .................................................................................... $2,536 $ 297 $ 2,239
Foreign currency exchange rate .................................................................... 171 (296) 467
Credit ........................................................................................ 173 14 159
Equity ........................................................................................ 6 75 (69)
Non-VA embedded derivatives ..................................................................... 17 (81) 98
Total non-VA program derivatives ................................................................. 2,903 9 2,894
VA program derivatives
Market and other risks in embedded derivatives ........................................................ (3,123) (210) (2,913)
Nonperformance risk on embedded derivatives ........................................................ 1,822 (96) 1,918
Total embedded derivatives ..................................................................... (1,301) (306) (995)
Freestanding derivatives hedging embedded derivatives ................................................. 3,222 32 3,190
Total VA program derivatives ..................................................................... 1,921 (274) 2,195
Net derivative gains (losses) ................................................................... $4,824 $ (265) $ 5,089
The favorable change in net derivative gains (losses) on non–VA program derivatives was $2.9 billion ($1.9 billion, net of income tax). This was primarily due
to interest rates decreasing more in the current period than in the prior period favorably impacting receive–fixed interest rate swaps, long interest rate floors, long
interest rate futures, and receiver swaptions. These freestanding derivatives are primarily hedging long duration liability portfolios. The strengthening of the U.S.
dollar and Japanese yen relative to other key currencies favorably impacted foreign currency forwards and swaps, which primarily hedge certain foreign
denominated bonds. Additionally, the widening of credit spreads favorably impacted credit default swaps hedging certain bonds. Because certain of these
hedging strategies are not designated or do not qualify as accounting hedges, the changes in the estimated fair value of these freestanding derivatives are
recognized in net derivative gains (losses) without an offsetting gain or loss recognized in earnings for the item being hedged.
20 MetLife, Inc.