MetLife 2012 Annual Report Download - page 48
Download and view the complete annual report
Please find page 48 of the 2012 MetLife annual report below. You can navigate through the pages in the report by either clicking on the pages listed below, or by using the keyword search tool below to find specific information within the annual report.-
 1
1 -
2
-
3
-
4
-
5
-
6
-
7
-
8
-
9
-
10
-
11
-
12
-
13
-
14
-
15
-
16
-
17
-
18
-
19
-
20
-
21
-
22
-
23
-
24
-
25
-
26
-
27
-
28
-
29
-
30
-
31
-
32
-
33
-
34
-
35
-
36
-
37
-
 38
38 -
 39
39 -
 40
40 -
 41
41 -
 42
42 -
 43
43 -
 44
44 -
 45
45 -
 46
46 -
 47
47 -
 48
48 -
 49
49 -
 50
50 -
 51
51 -
 52
52 -
 53
53 -
 54
54 -
 55
55 -
 56
56 -
 57
57 -
 58
58 -
59
-
60
-
61
-
62
-
63
-
64
-
65
-
66
-
67
-
68
-
69
-
70
-
71
-
72
-
73
-
74
-
75
-
76
-
77
-
78
-
79
-
80
-
81
-
82
-
83
-
84
-
85
-
86
-
87
-
88
-
89
-
90
-
91
-
92
-
93
-
94
-
95
-
96
-
97
-
98
-
99
-
100
-
101
-
102
-
103
-
104
-
105
-
106
-
107
-
108
-
109
-
110
-
111
-
112
-
113
-
114
-
115
-
116
-
117
-
118
-
119
-
120
-
121
-
122
-
123
-
124
-
125
-
126
-
127
-
128
-
129
-
130
-
131
-
132
-
133
-
134
-
135
-
136
-
137
-
138
-
139
-
140
-
141
-
142
-
143
-
144
-
145
-
146
-
147
-
148
-
149
-
150
-
151
-
152
-
153
-
154
-
155
-
156
-
157
-
158
-
159
-
160
-
161
-
162
-
163
-
164
-
165
-
166
-
167
-
168
-
169
-
170
-
171
-
172
-
173
-
174
-
175
-
176
-
177
-
178
-
179
-
180
-
181
-
182
-
183
-
184
-
185
-
186
-
187
-
188
-
189
-
190
-
191
-
192
-
193
-
194
-
195
-
196
-
197
-
198
-
199
-
200
-
201
-
202
-
203
-
204
-
205
-
206
-
207
-
208
-
209
-
210
-
211
-
212
-
213
-
214
-
215
 |
 |

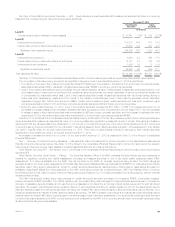
Historically, we have managed our exposure to sub-prime RMBS holdings by reducing our overall exposure, stress testing the portfolio with severe
loss assumptions and closely monitoring the performance of the portfolio. At December 31, 2012 and 2011, approximately 53% and 79%, respectively,
of our sub-prime RMBS holdings were in a vintage year of 2005 or prior. These older vintage years benefit from better underwriting, improved credit
enhancement levels and higher residential property price appreciation. In 2012, we increased our exposure to sub-prime RMBS by purchasing sub-
prime RMBS at significant discounts to the expected principal recovery value of these securities. The 2012 sub-prime RMBS purchases are performing
within our expectations and were in an unrealized gain position of $59 million at December 31, 2012.
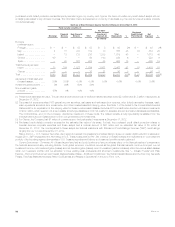
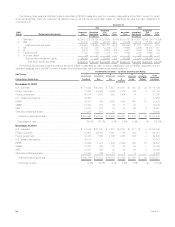
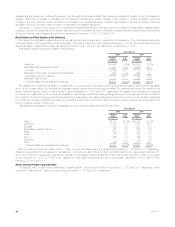
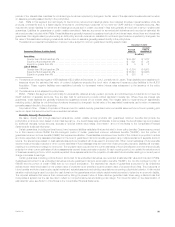
CMBS. The following tables present our CMBS holdings by rating agency designation and by vintage year at:
December 31, 2012
Aaa Aa A Baa
Below
Investment
Grade Total
Amortized
Cost Estimated
Fair Value Amortized
Cost Estimated
Fair Value Amortized
Cost Estimated
Fair Value Amortized
Cost Estimated
Fair Value Amortized
Cost Estimated
Fair Value Amortized
Cost Estimated
Fair Value
(In millions)
2003 .................... $ 2,957 $ 2,997 $ 113 $ 114 $ 82 $ 82 $ 37 $ 36 $ 33 $ 33 $ 3,222 $ 3,262
2004 .................... 3,466 3,606 380 401 97 99 52 51 21 9 4,016 4,166
2005 .................... 3,348 3,636 303 329 275 296 144 142 — — 4,070 4,403
2006 .................... 2,283 2,484 263 284 44 44 47 50 38 36 2,675 2,898
2007 .................... 1,070 1,143 112 117 87 95 194 187 20 21 1,483 1,563
2008 - 2010 .............. 2 3 — — — — 56 60 26 24 84 87
2011 .................... 598 650 12 11 108 112 — — 7 6 725 779
2012 .................... 524 559 403 417 939 956 — — 36 39 1,902 1,971
Total .................. $14,248 $ 15,078 $ 1,586 $ 1,673 $ 1,632 $ 1,684 $ 530 $ 526 $ 181 $ 168 $18,177 $ 19,129
Ratings Distribution ......... 78.8% 8.7% 8.8% 2.8% 0.9% 100.0%
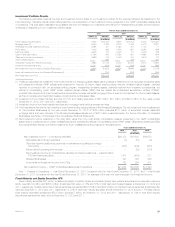
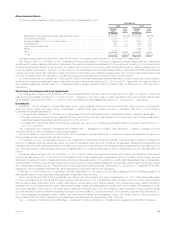
December 31, 2011
Aaa Aa A Baa
Below
Investment
Grade Total
Amortized
Cost
Estimated
Fair
Value Amortized
Cost Estimated
Fair Value Amortized
Cost Estimated
Fair Value Amortized
Cost Estimated
Fair Value Amortized
Cost Estimated
Fair Value Amortized
Cost Estimated
Fair Value
(In millions)
2003 ......................$ 5,574 $ 5,677 $ 176 $ 176 $ 91 $ 88 $ 54 $ 52 $ 29 $ 27 $ 5,924 $ 6,020
2004 ...................... 3,586 3,730 430 440 135 129 83 80 32 25 4,266 4,404
2005 ...................... 3,081 3,318 427 432 277 269 184 175 31 28 4,000 4,222
2006 ...................... 1,712 1,835 245 237 89 83 118 110 123 106 2,287 2,371
2007 ...................... 643 665 395 332 163 138 67 71 94 88 1,362 1,294
2008 - 2010 ................ 3 3 — — — — 60 66 25 27 88 96
2011 ...................... 536 557 1 1 92 96 — — 9 8 638 662
Total .....................$15,135 $ 15,785 $ 1,674 $ 1,618 $ 847 $ 803 $ 566 $ 554 $ 343 $ 309 $18,565 $ 19,069
Ratings Distribution ........... 82.8% 8.5% 4.2% 2.9% 1.6% 100.0%
The tables above reflect rating agency designations assigned by nationally recognized rating agencies including Moody’s, S&P, Fitch and Realpoint,
LLC. CMBS rated NAIC 1 were 98.5% and 96.5% of total CMBS at December 31, 2012 and 2011, respectively.
42 MetLife, Inc.