MetLife 2012 Annual Report Download - page 167
Download and view the complete annual report
Please find page 167 of the 2012 MetLife annual report below. You can navigate through the pages in the report by either clicking on the pages listed below, or by using the keyword search tool below to find specific information within the annual report.
MetLife, Inc.
Notes to the Consolidated Financial Statements — (Continued)
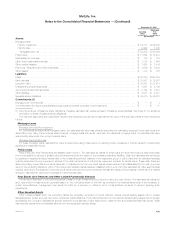
December 31, 2011
Carrying
Value
Estimated
Fair
Value
(In millions)
Assets:
Mortgage loans:
Held-for-investment ................................................................................. $ 53,777 $ 56,422
Held-for-sale ....................................................................................... 4,462 4,462
Mortgage loans, net ............................................................................... $ 58,239 $ 60,884
Policy loans .......................................................................................... $ 11,892 $ 14,213
Real estate joint ventures ............................................................................... $ 130 $ 183
Other limited partnership interests ........................................................................ $ 1,318 $ 1,656
Other invested assets .................................................................................. $ 1,434 $ 1,434
Premiums, reinsurance and other receivables ............................................................... $ 4,639 $ 5,232
Other assets ......................................................................................... $ 310 $ 308
Liabilities:
PABs .............................................................................................. $146,890 $153,304
Bank deposits ........................................................................................ $ 10,507 $ 10,507
Long-term debt ....................................................................................... $ 20,587 $ 22,514
Collateral financing arrangements ......................................................................... $ 4,647 $ 4,136
Junior subordinated debt securities ....................................................................... $ 3,192 $ 3,491
Other liabilities ........................................................................................ $ 4,087 $ 4,087
Separate account liabilities .............................................................................. $ 49,610 $ 49,610
Commitments: (1)
Mortgage loan commitments ............................................................................ $ — $ 3
Commitments to fund bank credit facilities, bridge loans and private corporate bond investments ....................... $ — $ 51
(1) Commitments are off-balance sheet obligations. Negative estimated fair values represent off-balance sheet liabilities. See Note 21 for additional
information on these off-balance sheet obligations.
The methods, assumptions and significant valuation techniques and inputs used to estimate the fair value of financial instruments are summarized as
follows:
Mortgage Loans
Mortgage loans held-for-investment
For commercial and agricultural mortgage loans, the estimated fair value was primarily determined by estimating expected future cash flows and
discounting them using current interest rates for similar mortgage loans with similar credit risk. For residential mortgage loans, the estimated fair value
was primarily determined from pricing for similar loans.
Mortgage loans held-for-sale
For these mortgage loans, estimated fair value is determined using independent non-binding broker quotations or internal valuation models using
significant unobservable inputs.
Policy Loans
Policy loans with fixed interest rates are classified within Level 3. The estimated fair values for these loans are determined using a discounted cash
flow model applied to groups of similar policy loans determined by the nature of the underlying insurance liabilities. Cash flow estimates are developed
by applying a weighted-average interest rate to the outstanding principal balance of the respective group of policy loans and an estimated average
maturity determined through experience studies of the past performance of policyholder repayment behavior for similar loans. These cash flows are
discounted using current risk-free interest rates with no adjustment for borrower credit risk as these loans are fully collateralized by the cash surrender
value of the underlying insurance policy. Policy loans with variable interest rates are classified within Level 2 and the estimated fair value approximates
carrying value due to the absence of borrower credit risk and the short time period between interest rate resets, which presents minimal risk of a material
change in estimated fair value due to changes in market interest rates.
Real Estate Joint Ventures and Other Limited Partnership Interests
The amounts disclosed in the preceding tables consist of those investments accounted for using the cost method. The estimated fair values for
such cost method investments are generally based on the Company’s share of the NAV as provided in the financial statements of the investees. In
certain circumstances, management may adjust the NAV by a premium or discount when it has sufficient evidence to support applying such
adjustments.
Other Invested Assets
Other invested assets within the preceding tables are principally comprised of funds withheld, various interest-bearing assets held in foreign
subsidiaries and certain amounts due under contractual indemnifications. For funds withheld and for the various interest-bearing assets held in foreign
subsidiaries, the Company evaluates the specific facts and circumstances of each instrument to determine the appropriate estimated fair values. These
estimated fair values were not materially different from the recognized carrying values.
MetLife, Inc. 161


