MetLife 2012 Annual Report Download - page 112
Download and view the complete annual report
Please find page 112 of the 2012 MetLife annual report below. You can navigate through the pages in the report by either clicking on the pages listed below, or by using the keyword search tool below to find specific information within the annual report.-
 1
1 -
2
-
3
-
4
-
5
-
6
-
7
-
8
-
9
-
10
-
11
-
12
-
13
-
14
-
15
-
16
-
17
-
18
-
19
-
20
-
21
-
22
-
23
-
24
-
25
-
26
-
27
-
28
-
29
-
30
-
31
-
32
-
33
-
34
-
35
-
36
-
37
-
38
-
39
-
40
-
41
-
42
-
43
-
44
-
45
-
46
-
47
-
48
-
49
-
50
-
51
-
52
-
53
-
54
-
55
-
56
-
57
-
58
-
59
-
60
-
61
-
62
-
63
-
64
-
65
-
66
-
67
-
68
-
69
-
70
-
71
-
72
-
73
-
74
-
75
-
76
-
77
-
78
-
79
-
80
-
81
-
82
-
83
-
84
-
85
-
86
-
87
-
88
-
89
-
90
-
91
-
92
-
93
-
94
-
95
-
96
-
97
-
98
-
99
-
100
-
101
-
 102
102 -
 103
103 -
 104
104 -
 105
105 -
 106
106 -
 107
107 -
 108
108 -
 109
109 -
 110
110 -
 111
111 -
 112
112 -
 113
113 -
 114
114 -
 115
115 -
 116
116 -
 117
117 -
 118
118 -
 119
119 -
 120
120 -
 121
121 -
 122
122 -
123
-
124
-
125
-
126
-
127
-
128
-
129
-
130
-
131
-
132
-
133
-
134
-
135
-
136
-
137
-
138
-
139
-
140
-
141
-
142
-
143
-
144
-
145
-
146
-
147
-
148
-
149
-
150
-
151
-
152
-
153
-
154
-
155
-
156
-
157
-
158
-
159
-
160
-
161
-
162
-
163
-
164
-
165
-
166
-
167
-
168
-
169
-
170
-
171
-
172
-
173
-
174
-
175
-
176
-
177
-
178
-
179
-
180
-
181
-
182
-
183
-
184
-
185
-
186
-
187
-
188
-
189
-
190
-
191
-
192
-
193
-
194
-
195
-
196
-
197
-
198
-
199
-
200
-
201
-
202
-
203
-
204
-
205
-
206
-
207
-
208
-
209
-
210
-
211
-
212
-
213
-
214
-
215
 |
 |

MetLife, Inc.
Notes to the Consolidated Financial Statements — (Continued)
Variable Annuity Guarantees
In the Event of Death
Defined as the guaranteed minimum death benefit less the total contract account value, as of the balance sheet date. It represents the amount of
the claim that the Company would incur if death claims were filed on all contracts on the balance sheet date.
At Annuitization
Defined as the amount (if any) that would be required to be added to the total contract account value to purchase a lifetime income stream, based
on current annuity rates, equal to the minimum amount provided under the guaranteed benefit. This amount represents the Company’s potential
economic exposure to such guarantees in the event all contractholders were to annuitize on the balance sheet date, even though the contracts contain
terms that only allow annuitization of the guaranteed amount after the 10th anniversary of the contract, which not all contractholders have achieved.
Two Tier Annuities
Defined as the excess of the upper tier, adjusted for a profit margin, less the lower tier, as of the balance sheet date. These contracts apply a lower
rate of funds if the contractholder elects to surrender the contract for cash and a higher rate if the contractholder elects to annuitize.
Universal and Variable Life Contracts
Defined as the guarantee amount less the account value, as of the balance sheet date. It represents the amount of the claim that the Company
would incur if death claims were filed on all contracts on the balance sheet date.
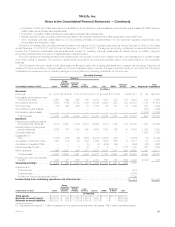
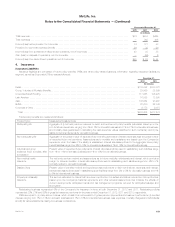
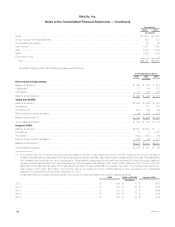
Information regarding the liabilities for guarantees (excluding base policy liabilities and embedded derivatives) relating to annuity and universal and
variable life contracts was as follows at:
December 31,
2012 2011
In the
Event of Death At
Annuitization In the
Event of Death At
Annuitization
(In millions)
Annuity Contracts (1)
Variable Annuity Guarantees
Total contract account value (3) .......................................... $184,095 $ 89,137 $163,845 $ 72,016
Separate account value ................................................ $143,893 $ 84,354 $121,841 $ 66,739
Net amount at risk .................................................... $ 9,501 $ 4,593 (2) $ 16,641 $ 2,686 (2)
Average attained age of contractholders ................................... 62years 62 years 62 years 61 years
Two Tier Annuities
General account value ................................................. N/A $ 848 N/A $ 386
Net amount at risk .................................................... N/A $ 232 N/A $ 60
Average attained age of contractholders ................................... N/A 51years N/A 60 years
December 31,
2012 2011
Secondary
Guarantees Paid-Up
Guarantees Secondary
Guarantees Paid-Up
Guarantees
(In millions)
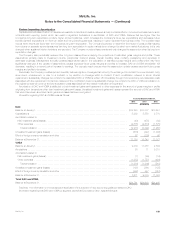
Universal and Variable Life Contracts (1)
Account value (general and separate account) .............................. $ 14,256 $ 3,828 $ 12,946 $ 3,963
Net amount at risk .................................................... $189,197 $ 23,276 $188,642 $ 24,991
Average attained age of policyholders ..................................... 54years 60 years 53 years 59 years
(1) The Company’s annuity and life contracts with guarantees may offer more than one type of guarantee in each contract. Therefore, the amounts
listed above may not be mutually exclusive.
(2) The Company had previously disclosed the NAR based on the excess of the benefit base over the contractholder’s total contract account value on
the balance sheet date. Such amounts were $9.7 billion and $12.1 billion at December 31, 2012 and 2011, respectively. The Company has
provided, in the table above, the NAR as defined above. The Company believes that this definition is more representative of the potential economic
exposures of these guarantees as the contractholders do not have access to this difference other than through annuitization.
(3) Includes amounts, which are not reported in the consolidated balance sheets, from assumed reinsurance of certain variable annuity products from
the Company’s former operating joint venture in Japan.
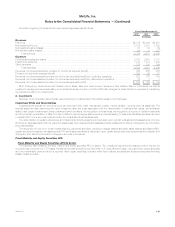
Obligations Under Funding Agreements
The Company issues fixed and floating rate funding agreements, which are denominated in either U.S. dollars or foreign currencies, to certain
special purpose entities (“SPEs”) that have issued either debt securities or commercial paper for which payment of interest and principal is secured by
such funding agreements. During the years ended December 31, 2012, 2011 and 2010, the Company issued $35.1 billion, $39.9 billion and
$34.1 billion, respectively, and repaid $31.1 billion, $41.6 billion and $30.9 billion, respectively, of such funding agreements. At December 31, 2012
and 2011, liabilities for funding agreements outstanding, which are included in PABs, were $30.0 billion and $25.5 billion, respectively.
Certain of the Company’s subsidiaries are members of the FHLB. Holdings of FHLB common stock by branch, included in equity securities, were as
follows at:
106 MetLife, Inc.