MetLife 2012 Annual Report Download - page 43
Download and view the complete annual report
Please find page 43 of the 2012 MetLife annual report below. You can navigate through the pages in the report by either clicking on the pages listed below, or by using the keyword search tool below to find specific information within the annual report.-
 1
1 -
2
-
3
-
4
-
5
-
6
-
7
-
8
-
9
-
10
-
11
-
12
-
13
-
14
-
15
-
16
-
17
-
18
-
19
-
20
-
21
-
22
-
23
-
24
-
25
-
26
-
27
-
28
-
29
-
30
-
31
-
32
-
 33
33 -
 34
34 -
 35
35 -
 36
36 -
 37
37 -
 38
38 -
 39
39 -
 40
40 -
 41
41 -
 42
42 -
 43
43 -
 44
44 -
 45
45 -
 46
46 -
 47
47 -
 48
48 -
 49
49 -
 50
50 -
 51
51 -
 52
52 -
 53
53 -
54
-
55
-
56
-
57
-
58
-
59
-
60
-
61
-
62
-
63
-
64
-
65
-
66
-
67
-
68
-
69
-
70
-
71
-
72
-
73
-
74
-
75
-
76
-
77
-
78
-
79
-
80
-
81
-
82
-
83
-
84
-
85
-
86
-
87
-
88
-
89
-
90
-
91
-
92
-
93
-
94
-
95
-
96
-
97
-
98
-
99
-
100
-
101
-
102
-
103
-
104
-
105
-
106
-
107
-
108
-
109
-
110
-
111
-
112
-
113
-
114
-
115
-
116
-
117
-
118
-
119
-
120
-
121
-
122
-
123
-
124
-
125
-
126
-
127
-
128
-
129
-
130
-
131
-
132
-
133
-
134
-
135
-
136
-
137
-
138
-
139
-
140
-
141
-
142
-
143
-
144
-
145
-
146
-
147
-
148
-
149
-
150
-
151
-
152
-
153
-
154
-
155
-
156
-
157
-
158
-
159
-
160
-
161
-
162
-
163
-
164
-
165
-
166
-
167
-
168
-
169
-
170
-
171
-
172
-
173
-
174
-
175
-
176
-
177
-
178
-
179
-
180
-
181
-
182
-
183
-
184
-
185
-
186
-
187
-
188
-
189
-
190
-
191
-
192
-
193
-
194
-
195
-
196
-
197
-
198
-
199
-
200
-
201
-
202
-
203
-
204
-
205
-
206
-
207
-
208
-
209
-
210
-
211
-
212
-
213
-
214
-
215
 |
 |

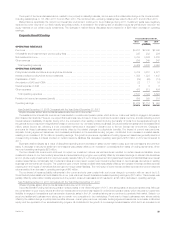
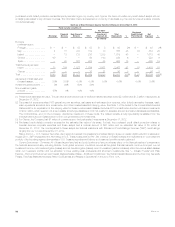
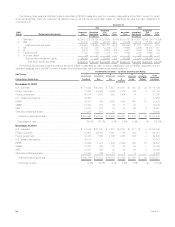
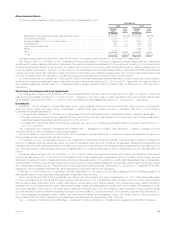
Investment Portfolio Results
The following yield table presents the yield and investment income (loss) for our investment portfolio for the periods indicated. As described in the
footnotes below, this table reflects certain differences from the presentation of net investment income presented in the GAAP consolidated statements
of operations. This yield table presentation is consistent with how we measure our investment performance for management purposes, and we believe it
enhances understanding of our investment portfolio results.
For the Years Ended December 31,
2012 2011 2010
Yield% (1) Amount Yield% (1) Amount Yield% (1) Amount
(In millions) (In millions) (In millions)
Fixed maturity securities (2) (3) ......................................... 4.85% $15,243 4.94% $15,016 5.54% $12,567
Mortgage loans (3) .................................................. 5.64% 3,190 5.53% 3,162 5.51% 2,821
Real estate and real estate joint ventures ................................. 4.59% 401 3.76% 307 1.10% 77
Policy loans ........................................................ 5.25% 626 5.43% 641 6.38% 649
Equity securities .................................................... 4.60% 133 4.44% 141 4.40% 128
Other limited partnerships ............................................. 12.76% 845 10.58% 681 14.99% 879
Cash and short-term investments ....................................... 0.69% 143 1.04% 155 0.61% 81
Other invested assets ................................................ 595 439 481
Total before investment fees and expenses ............................... 4.96% 21,176 5.00% 20,542 5.51% 17,683
Investment fees and expenses ......................................... (0.13) (554) (0.13) (546) (0.14) (465)
Net investment income including Divested Businesses ...................... 4.83% 20,622 4.87% 19,996 5.37% 17,218
Less: net investment income from Divested Businesses (4) ................... (150) (358) (365)
Net investment income (5) ............................................ $20,472 $19,638 $16,853
(1) Yields are calculated as investment income as a percent of average quarterly asset carrying values. Investment income excludes recognized gains
and losses and reflects GAAP adjustments presented in footnote (5) below. Asset carrying values exclude unrealized gains (losses), collateral
received in connection with our securities lending program, freestanding derivative assets, collateral received from derivative counterparties, the
effects of consolidating under GAAP certain variable interest entities (“VIEs”) that are treated as consolidated securitization entities (“CSEs”),
contractholder-directed unit-linked investments and securitized reverse residential mortgage loans. A yield is not presented for other invested assets,
as it is not considered a meaningful measure of performance for this asset class.
(2) Investment income (loss) includes amounts for FVO and trading securities of $88 million, $31 million and $234 million for the years ended
December 31, 2012, 2011 and 2010, respectively.
(3) Investment income from fixed maturity securities and mortgage loans includes prepayment fees.
(4) Yield calculations include the net investment income and ending carrying values of the Divested Businesses. The net investment income adjustment
for the Divested Businesses for the year ended December 31, 2012 of $150 million excludes $177 million of securitized reverse residential
mortgage loans that were included in the Divested Businesses adjustment of $327 million presented below. For further information on Divested
Businesses, see Note 2 of the Notes to the Consolidated Financial Statements.
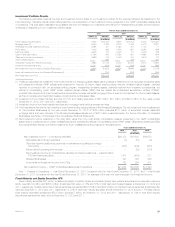
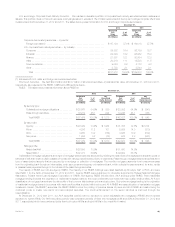
(5) Net investment income presented in the yield table varies from the most directly comparable measure presented in the GAAP consolidated
statements of operations due to certain reclassifications and excludes the effects of consolidating under GAAP certain VIEs that are treated as CSEs
and contractholder-directed unit-linked investments. Such reclassifications are presented in the table below.
Years Ended December 31,
2012 2011 2010
(In millions)
Net investment income — in the above yield table ................................... $20,472 $19,638 $16,853
Real estate discontinued operations ............................................ (3) (10) (9)
Scheduled periodic settlement payments on derivatives not qualifying for hedge
accounting .............................................................. (448) (249) (208)
Equity method operating joint ventures .......................................... — (23) (130)
Net investment income on contractholder-directed unit-linked investments — reported within
FVO and trading securities .................................................. 1,473 (453) 211
Divested Businesses ........................................................ 327 358 365
Incremental net investment income from CSEs .................................... 163 324 411
Net investment income — GAAP consolidated statements of operations .................. $21,984 $19,585 $17,493
See “— Results of Operations — Year Ended December 31, 2012 Compared with the Year Ended December 31, 2011” and “—Year Ended
December 31, 2011 Compared with the Year Ended December 31, 2010,” for analyses of the year over year changes in net investment income.
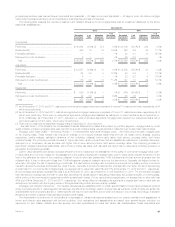
Fixed Maturity and Equity Securities AFS
Fixed maturity securities AFS, which consisted principally of publicly traded and privately placed fixed maturity securities and redeemable preferred
stock, were $374.3 billion and $350.3 billion at estimated fair value, or 70% and 67% of total cash and invested assets, at December 31, 2012 and
2011, respectively. Publicly-traded fixed maturity securities represented $323.8 billion and $303.6 billion of total fixed maturity securities at estimated fair
value at December 31, 2012 and 2011, respectively, or 87% of total fixed maturity securities, at both December 31, 2012 and 2011. Privately placed
fixed maturity securities represented $50.5 billion and $46.7 billion, at December 31, 2012 and 2011, respectively, or 13% of total fixed maturity
securities at estimated fair value, at both December 31, 2012 and 2011.
MetLife, Inc. 37