MetLife 2012 Annual Report Download - page 57
Download and view the complete annual report
Please find page 57 of the 2012 MetLife annual report below. You can navigate through the pages in the report by either clicking on the pages listed below, or by using the keyword search tool below to find specific information within the annual report.-
 1
1 -
2
-
3
-
4
-
5
-
6
-
7
-
8
-
9
-
10
-
11
-
12
-
13
-
14
-
15
-
16
-
17
-
18
-
19
-
20
-
21
-
22
-
23
-
24
-
25
-
26
-
27
-
28
-
29
-
30
-
31
-
32
-
33
-
34
-
35
-
36
-
37
-
38
-
39
-
40
-
41
-
42
-
43
-
44
-
45
-
46
-
 47
47 -
 48
48 -
 49
49 -
 50
50 -
 51
51 -
 52
52 -
 53
53 -
 54
54 -
 55
55 -
 56
56 -
 57
57 -
 58
58 -
 59
59 -
 60
60 -
 61
61 -
 62
62 -
 63
63 -
 64
64 -
 65
65 -
 66
66 -
 67
67 -
68
-
69
-
70
-
71
-
72
-
73
-
74
-
75
-
76
-
77
-
78
-
79
-
80
-
81
-
82
-
83
-
84
-
85
-
86
-
87
-
88
-
89
-
90
-
91
-
92
-
93
-
94
-
95
-
96
-
97
-
98
-
99
-
100
-
101
-
102
-
103
-
104
-
105
-
106
-
107
-
108
-
109
-
110
-
111
-
112
-
113
-
114
-
115
-
116
-
117
-
118
-
119
-
120
-
121
-
122
-
123
-
124
-
125
-
126
-
127
-
128
-
129
-
130
-
131
-
132
-
133
-
134
-
135
-
136
-
137
-
138
-
139
-
140
-
141
-
142
-
143
-
144
-
145
-
146
-
147
-
148
-
149
-
150
-
151
-
152
-
153
-
154
-
155
-
156
-
157
-
158
-
159
-
160
-
161
-
162
-
163
-
164
-
165
-
166
-
167
-
168
-
169
-
170
-
171
-
172
-
173
-
174
-
175
-
176
-
177
-
178
-
179
-
180
-
181
-
182
-
183
-
184
-
185
-
186
-
187
-
188
-
189
-
190
-
191
-
192
-
193
-
194
-
195
-
196
-
197
-
198
-
199
-
200
-
201
-
202
-
203
-
204
-
205
-
206
-
207
-
208
-
209
-
210
-
211
-
212
-
213
-
214
-
215
 |
 |

periods of low interest rates. Liabilities for unit-linked-type funds are impacted by changes in the fair value of the associated investments, as the return
on assets is generally passed directly to the policyholder.
Asia. PABs in this segment are held largely for fixed income retirement and savings plans, fixed deferred annuities, interest sensitive whole life
products, universal life and, to a lesser degree, amounts for unit-linked-type funds that do not meet the GAAP definition of separate accounts. Also
included are certain liabilities for retirement and savings products sold in certain countries in Asia that generally are sold with minimum credited rate
guarantees. Liabilities for guarantees on certain variable annuities in Asia are accounted for as embedded derivatives and recorded at estimated fair
value and are also included within PABs. These liabilities are generally impacted by sustained periods of low interest rates, where there are interest rate
guarantees. We mitigate risks by implementing an ALM policy and with reinsurance. Liabilities for unit-linked-type funds are impacted by changes in the
fair value of the associated underlying investments, as the return on assets is generally passed directly to the policyholder.
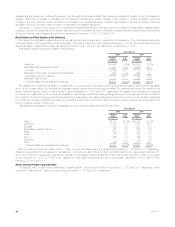
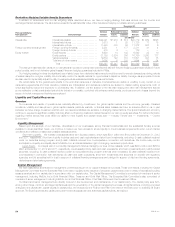
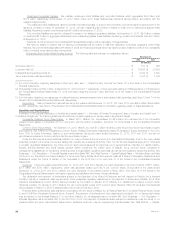
The table below presents the breakdown of account value subject to minimum guaranteed crediting rates for Asia:
December 31, 2012
Guaranteed Minimum Crediting Rate(1) Account
Value (2)
Account
Value at
Guarantee (2)
(In millions)
Annuities:
Greater than 0% but less than 2% ..................................................... $33,542 $ 1,222
Equal to 2% but less than 4% ........................................................ $ 621 $ 24
Equal to or greater than 4% .......................................................... $ 5 $ 2
Life & Other:
Greater than 0% but less than 2% ..................................................... $ 6,254 $ 4,968
Equal to 2% but less than 4% ........................................................ $16,543 $ 9,666
Equal to or greater than 4% .......................................................... $ 258 $ —
(1) The table above excludes negative VOBA liabilities of $2.9 billion at December 31, 2012, primarily held in Japan. These liabilities were established in
instances where the estimated fair value of contract obligations exceeded the book value of assumed insurance policy liabilities in the ALICO
Acquisition. These negative liabilities were established primarily for decreased market interest rates subsequent to the issuance of the policy
contracts.
(2) The table above is not adjusted for policy loans.
EMEA. PABs in this segment are held mostly for universal life, deferred annuity, pension products, and unit-linked-type funds that do not meet the
GAAP definition of separate accounts. They are also held for endowment products without significant mortality risk. Where there are interest rate
guarantees, these liabilities are generally impacted by sustained periods of low interest rates. We mitigate risks by implementing an asset/liability
matching policy. Liabilities for unit-linked-type funds are impacted by changes in the fair value of the associated investments, as the return on assets is
generally passed directly to the policyholder.
Corporate & Other. PABs in Corporate & Other are held for variable annuity guaranteed minimum benefits assumed from a former operating joint
venture in Japan that are accounted for as embedded derivatives.
Variable Annuity Guarantees
We issue, directly and through assumed reinsurance, certain variable annuity products with guaranteed minimum benefits that provide the
policyholder a minimum return based on their initial deposit (i.e., the benefit base) less withdrawals. In some cases, the benefit base may be increased
by additional deposits, bonus amounts, accruals or optional market value resets. See Notes 1 and 4 of the Notes to the Consolidated Financial
Statements for additional information.
Certain guarantees, including portions thereof, have insurance liabilities established that are included in future policy benefits. Guarantees accounted
for in this manner include GMDB, the life-contingent portion of certain guaranteed minimum withdrawal benefits (“GMWB”), and the portion of
guaranteed minimum income benefits (“GMIB”) that requires annuitization. These liabilities are accrued over the life of the contract in proportion to actual
and future expected policy assessments based on the level of guaranteed minimum benefits generated using multiple scenarios of separate account
returns. The scenarios are based on best estimate assumptions consistent with those used to amortize DAC. When current estimates of future benefits
exceed those previously projected or when current estimates of future assessments are lower than those previously projected, liabilities will increase,
resulting in a current period charge to net income. The opposite result occurs when the current estimates of future benefits are lower than that previously
projected or when current estimates of future assessments exceed those previously projected. At each reporting period, we update the actual amount
of business remaining in-force, which impacts expected future assessments and the projection of estimated future benefits resulting in a current period
charge or increase to earnings.
Certain guarantees, including portions thereof, accounted for as embedded derivatives, are recorded at estimated fair value and included in PABs.
Guarantees accounted for as embedded derivatives include guaranteed minimum accumulation benefits (“GMAB”), the non life-contingent portion of
GMWB and the portion of certain GMIB that do not require annuitization. The estimated fair values of guarantees accounted for as embedded
derivatives are determined based on the present value of projected future benefits minus the present value of projected future fees. The projections of
future benefits and future fees require capital market and actuarial assumptions including expectations concerning policyholder behavior. A risk neutral
valuation methodology is used to project the cash flows from the guarantees under multiple capital market scenarios to determine an economic liability.
The reported estimated fair value is then determined by taking the present value of these risk-free generated cash flows using a discount rate that
incorporates a spread over the risk free rate to reflect our nonperformance risk and adding a risk margin. For more information on the determination of
estimated fair value, see Note 10 of the Notes to the Consolidated Financial Statements.
MetLife, Inc. 51