MetLife 2012 Annual Report Download - page 190
Download and view the complete annual report
Please find page 190 of the 2012 MetLife annual report below. You can navigate through the pages in the report by either clicking on the pages listed below, or by using the keyword search tool below to find specific information within the annual report.-
 1
1 -
2
-
3
-
4
-
5
-
6
-
7
-
8
-
9
-
10
-
11
-
12
-
13
-
14
-
15
-
16
-
17
-
18
-
19
-
20
-
21
-
22
-
23
-
24
-
25
-
26
-
27
-
28
-
29
-
30
-
31
-
32
-
33
-
34
-
35
-
36
-
37
-
38
-
39
-
40
-
41
-
42
-
43
-
44
-
45
-
46
-
47
-
48
-
49
-
50
-
51
-
52
-
53
-
54
-
55
-
56
-
57
-
58
-
59
-
60
-
61
-
62
-
63
-
64
-
65
-
66
-
67
-
68
-
69
-
70
-
71
-
72
-
73
-
74
-
75
-
76
-
77
-
78
-
79
-
80
-
81
-
82
-
83
-
84
-
85
-
86
-
87
-
88
-
89
-
90
-
91
-
92
-
93
-
94
-
95
-
96
-
97
-
98
-
99
-
100
-
101
-
102
-
103
-
104
-
105
-
106
-
107
-
108
-
109
-
110
-
111
-
112
-
113
-
114
-
115
-
116
-
117
-
118
-
119
-
120
-
121
-
122
-
123
-
124
-
125
-
126
-
127
-
128
-
129
-
130
-
131
-
132
-
133
-
134
-
135
-
136
-
137
-
138
-
139
-
140
-
141
-
142
-
143
-
144
-
145
-
146
-
147
-
148
-
149
-
150
-
151
-
152
-
153
-
154
-
155
-
156
-
157
-
158
-
159
-
160
-
161
-
162
-
163
-
164
-
165
-
166
-
167
-
168
-
169
-
170
-
171
-
172
-
173
-
174
-
175
-
176
-
177
-
178
-
179
-
 180
180 -
 181
181 -
 182
182 -
 183
183 -
 184
184 -
 185
185 -
 186
186 -
 187
187 -
 188
188 -
 189
189 -
 190
190 -
 191
191 -
 192
192 -
 193
193 -
 194
194 -
 195
195 -
 196
196 -
 197
197 -
 198
198 -
 199
199 -
 200
200 -
201
-
202
-
203
-
204
-
205
-
206
-
207
-
208
-
209
-
210
-
211
-
212
-
213
-
214
-
215
 |
 |

MetLife, Inc.
Notes to the Consolidated Financial Statements — (Continued)
Pension Benefits Other Postretirement Benefits
U.S. Plans Non-U.S. Plans U.S. Plans Non-U.S. Plans
Years Ended December 31,
2012 2011 2010 2012 2011 2010 2012 2011 2010 2012 2011 2010
(In millions)
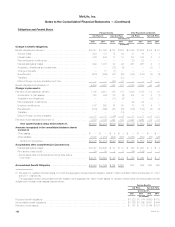
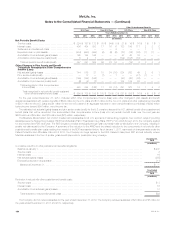
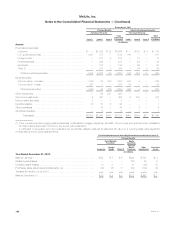
Net Periodic Benefit Costs:
Service costs ................................... $ 224 $ 187 $ 172 $ 75 $ 64 $ 8 $ 21 $ 16 $ 16 $ 1 $ 1 $ 1
Interest costs ................................... 406 404 393 17 16 6 103 106 111 2 2 2
Settlement and curtailment costs ................... —————8———111
Expected return on plan assets ..................... (484) (448) (444) (6) (6) (6) (77) (76) (79) (1) (1) —
Amortization of net actuarial (gains) losses ............ 195 194 196 — — — 57 43 38 — — —
Amortization of prior service costs (credit) ............. 6 4 7 — — — (104) (108) (83) — — —
Total net periodic benefit costs (credit) ............. 347 341 324 86 74 16 — (19) 3 3 3 4
Other Changes in Plan Assets and Benefit
Obligations Recognized in Other Comprehensive
Income (Loss):
Net actuarial (gains) losses ........................ 744 575 37 18 34 (15) 234 262 49 2 5 1
Prior service costs (credit) ......................... — 17 — (1) — 1 — — (81) (1) — 1
Amortization of net actuarial gains (losses) ............ (195) (194) (196) — — — (57) (43) (38) — — —
Amortization of prior service (costs) credit ............. (6) (4) (7) — — — 104 108 83 — — —
Total recognized in other comprehensive
income (loss) ............................... 543 394 (166) 17 34 (14) 281 327 13 1 5 2
Total recognized in net periodic benefit costs and
other comprehensive income (loss) ............ $ 890 $ 735 $ 158 $ 103 $ 108 $ 2 $ 281 $ 308 $ 16 $ 4 $ 8 $ 6
For the year ended December 31, 2012, included within other comprehensive income (loss) were other changes in plan assets and benefit
obligations associated with pension benefits of $543 million for the U.S. plans and $17 million for the non-U.S. plans and other postretirement benefits
of $281 million for the U.S. plans and $1 million for the non-U.S. plans for an aggregate reduction in other comprehensive income (loss) of $842 million
before income tax and $546 million, net of income tax.
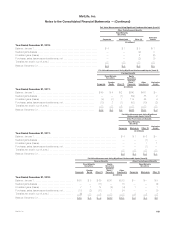
The estimated net actuarial (gains) losses and prior service costs (credit) for the U.S. pension plans and the U.S. defined benefit other postretirement
benefit plans that will be amortized from accumulated other comprehensive income (loss) into net periodic benefit costs over the next year are
$225 million and $6 million, and $73 million and ($75) million, respectively.
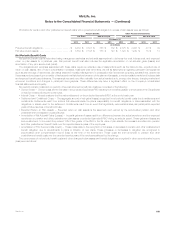
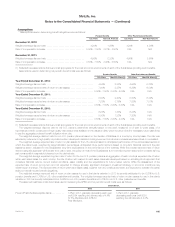
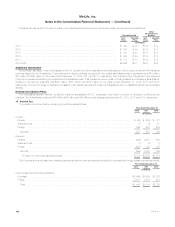
The Medicare Modernization Act of 2003 created various subsidies for all U.S. sponsors of retiree drug programs. Two common ways of providing
subsidies were the Retiree Drug Subsidy (“RDS”) and Medicare Part D Prescription Drug Plans (“PDP”). From 2006 through 2010, the Company applied
for and received the RDS each year. The RDS program provides the subsidy through cash payments made by Medicare to the Company, resulting in
smaller net claims paid by the Company. A summary of the reduction to the APBO and the related reduction to the components of net periodic other
postretirement benefits plan costs resulting from receipt of the RDS is presented below. As of January 1, 2011, as a result of changes made under the
Patient Protection and Affordable Care Act of 2010, the Company no longer applies for the RDS. Instead it has joined PDP and will indirectly receive
Medicare subsidies in the form of smaller gross benefit payments for prescription drug coverage.
December 31,
2010
(In millions)
Cumulative reduction in other postretirement benefits obligations:
Balance at January 1, ..................................................................................... $247
Service costs ............................................................................................ 3
Interest costs ............................................................................................ 16
Net actuarial (gains) losses ................................................................................. (255)
Expected prescription drug subsidy ........................................................................... (11)
Balance at December 31, ................................................................................ $ —
Year Ended
December 31,
2010
(In millions)
Reduction in net periodic other postretirement benefit costs:
Service costs ............................................................................................ $ 3
Interest costs ............................................................................................ 16
Amortization of net actuarial (gains) losses ...................................................................... 10
Total reduction in net periodic benefit costs ................................................................... $29
The Company did not receive subsidies for the year ended December 31, 2012. The Company received subsidies of $3 million and $8 million for
the years ended December 31, 2011 and 2010, respectively.
184 MetLife, Inc.