MetLife 2012 Annual Report Download - page 35
Download and view the complete annual report
Please find page 35 of the 2012 MetLife annual report below. You can navigate through the pages in the report by either clicking on the pages listed below, or by using the keyword search tool below to find specific information within the annual report.-
 1
1 -
2
-
3
-
4
-
5
-
6
-
7
-
8
-
9
-
10
-
11
-
12
-
13
-
14
-
15
-
16
-
17
-
18
-
19
-
20
-
21
-
22
-
23
-
24
-
 25
25 -
 26
26 -
 27
27 -
 28
28 -
 29
29 -
 30
30 -
 31
31 -
 32
32 -
 33
33 -
 34
34 -
 35
35 -
 36
36 -
 37
37 -
 38
38 -
 39
39 -
 40
40 -
 41
41 -
 42
42 -
 43
43 -
 44
44 -
 45
45 -
46
-
47
-
48
-
49
-
50
-
51
-
52
-
53
-
54
-
55
-
56
-
57
-
58
-
59
-
60
-
61
-
62
-
63
-
64
-
65
-
66
-
67
-
68
-
69
-
70
-
71
-
72
-
73
-
74
-
75
-
76
-
77
-
78
-
79
-
80
-
81
-
82
-
83
-
84
-
85
-
86
-
87
-
88
-
89
-
90
-
91
-
92
-
93
-
94
-
95
-
96
-
97
-
98
-
99
-
100
-
101
-
102
-
103
-
104
-
105
-
106
-
107
-
108
-
109
-
110
-
111
-
112
-
113
-
114
-
115
-
116
-
117
-
118
-
119
-
120
-
121
-
122
-
123
-
124
-
125
-
126
-
127
-
128
-
129
-
130
-
131
-
132
-
133
-
134
-
135
-
136
-
137
-
138
-
139
-
140
-
141
-
142
-
143
-
144
-
145
-
146
-
147
-
148
-
149
-
150
-
151
-
152
-
153
-
154
-
155
-
156
-
157
-
158
-
159
-
160
-
161
-
162
-
163
-
164
-
165
-
166
-
167
-
168
-
169
-
170
-
171
-
172
-
173
-
174
-
175
-
176
-
177
-
178
-
179
-
180
-
181
-
182
-
183
-
184
-
185
-
186
-
187
-
188
-
189
-
190
-
191
-
192
-
193
-
194
-
195
-
196
-
197
-
198
-
199
-
200
-
201
-
202
-
203
-
204
-
205
-
206
-
207
-
208
-
209
-
210
-
211
-
212
-
213
-
214
-
215
 |
 |

The impact of the items discussed above, related to our property & casualty business, can be seen in the unfavorable change in the combined ratio,
including catastrophes, to 101.9% in 2011 from 93.8% in 2010. The combined ratio, excluding catastrophes, was 90.2% in 2011 and 90.0% in 2010.
Market factors, specifically the current low interest rate environment, continued to be a challenge during 2011. Investment yields were negatively
impacted by lower returns on our fixed maturity securities portfolio, a decrease in the crediting rate on allocated equity as well as lower returns in the
equity markets on our private equity investments. The changes in market factors discussed above resulted in a $26 million decrease in operating
earnings.
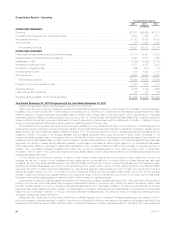
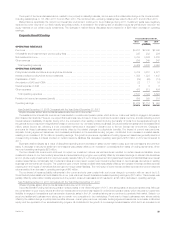
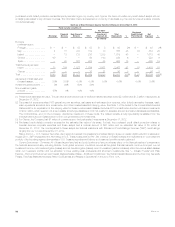
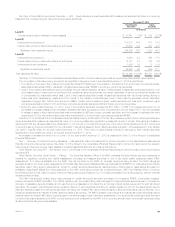
Corporate Benefit Funding
Years Ended December 31,
2012 2011 2010
(In millions)
OPERATING REVENUES
Premiums ....................................................................................... $3,237 $2,848 $2,345
Universal life and investment-type product policy fees ..................................................... 225 232 226
Net investment income ............................................................................. 5,703 5,506 5,280
Other revenues ................................................................................... 259 249 247
Total operating revenues .......................................................................... 9,424 8,835 8,098
OPERATING EXPENSES
Policyholder benefits and claims and policyholder dividends ................................................ 5,704 5,287 4,677
Interest credited to policyholder account balances ........................................................ 1,358 1,323 1,447
Capitalization of DAC .............................................................................. (29) (25) (18)
Amortization of DAC and VOBA ...................................................................... 22 17 16
Interest expense on debt ........................................................................... 8 9 8
Other expenses .................................................................................. 478 513 494
Total operating expenses ......................................................................... 7,541 7,124 6,624
Provision for income tax expense (benefit) .............................................................. 659 599 516
Operating earnings ................................................................................ $1,224 $1,112 $ 958
Year Ended December 31, 2012 Compared with the Year Ended December 31, 2011
Unless otherwise stated, all amounts discussed below are net of income tax.
The sustained low interest rate environment has resulted in underfunded pension plans, which limits our customers’ ability to engage in full pension
plan closeout terminations. However, we expect that customers may choose to close out portions of pension plans over time, at costs reflecting current
interest rates and availability of capital. During 2012, the conversion of an existing contract involving the transfer of funds from the separate account to
the general account resulted in a significant increase in premiums in our domestic closeout business. Structured settlement sales have decreased $463
million, before income tax, reflecting a more competitive market and a decrease in demand due to the low interest rate environment. Changes in
premiums for these businesses were almost entirely offset by the related changes in policyholder benefits. The impact of current year premiums,
deposits, funding agreement issuances, and increased participation in the securities lending program, contributed to an increase in invested assets,
resulting in an increase of $179 million in operating earnings. The growth in premiums, deposits and funding agreement issuances generally result in a
corresponding increase in interest credited on certain insurance liabilities; this decreased operating earnings by $158 million in 2012 as comparedto
2011.
Expenses declined largely as a result of disciplined spending and a decrease in sales volume-related costs, such as commissions and premium
taxes. A decrease in structured settlement commissions was partially offset by an increase in commissions from sales of funding agreements, which
improved operating earnings by $23 million.
The low interest rate environment continued to impact our investment returns, as well as interest credited on certain insurance liabilities. Lower
investment returns on our fixed maturity securities and securities lending program were partially offset by increased earnings on interest rate derivatives
and on private equity investments from improved equity markets. Many of our funding agreement and guaranteed interest contract liabilities have interest
credited rates that are contractually tied to external indices and, as a result, we set lower interest credited rates on new business, as well as on existing
business with terms that can fluctuate. The positive impact of lower interest credited rates was partially offset by an increase in interest credited expense
resulting from the impact of derivatives that are used to hedge certain liabilities. The net impact of lower interest credited expense and lower investment
returns resulted in an increase in operating earnings of $43 million.
The net impact of insurance liability refinements in the current and prior year coupled with a prior year charge in connection with our use of the U.S.
Social Security Administration’s Death Master File in our post-retirement benefit business increased operating earnings by $31 million. This increase was
partially offset by unfavorable mortality experience in the pension closeout businesses which resulted in an $8 million decrease in operating earnings.
Year Ended December 31, 2011 Compared with the Year Ended December 31, 2010
Unless otherwise stated, all amounts discussed below are net of income tax.
Corporate Benefit Funding had strong pension closeout sales in the United Kingdom (“U.K.”), and strong sales of structured settlements. Although
the combination of poor equity returns and the low interest rate environment has resulted in underfunded pension plans, which reduces our customers’
flexibility to engage in transactions such as pension closeouts, sales in the U.K. remained strong as we continue to penetrate that market. Sales in our
structured settlement business were strong as we remain very competitive in the marketplace. Premiums for these businesses were almost entirely
offset by the related change in policyholder benefits. However, current year premiums, deposits, funding agreement issuances, an increase in allocated
equity, and the expansion of our securities lending program, all contributed to the growth of our average invested assets, which led to an increase in net
MetLife, Inc. 29