MetLife 2012 Annual Report Download - page 62
Download and view the complete annual report
Please find page 62 of the 2012 MetLife annual report below. You can navigate through the pages in the report by either clicking on the pages listed below, or by using the keyword search tool below to find specific information within the annual report.-
 1
1 -
2
-
3
-
4
-
5
-
6
-
7
-
8
-
9
-
10
-
11
-
12
-
13
-
14
-
15
-
16
-
17
-
18
-
19
-
20
-
21
-
22
-
23
-
24
-
25
-
26
-
27
-
28
-
29
-
30
-
31
-
32
-
33
-
34
-
35
-
36
-
37
-
38
-
39
-
40
-
41
-
42
-
43
-
44
-
45
-
46
-
47
-
48
-
49
-
50
-
51
-
 52
52 -
 53
53 -
 54
54 -
 55
55 -
 56
56 -
 57
57 -
 58
58 -
 59
59 -
 60
60 -
 61
61 -
 62
62 -
 63
63 -
 64
64 -
 65
65 -
 66
66 -
 67
67 -
 68
68 -
 69
69 -
 70
70 -
 71
71 -
 72
72 -
73
-
74
-
75
-
76
-
77
-
78
-
79
-
80
-
81
-
82
-
83
-
84
-
85
-
86
-
87
-
88
-
89
-
90
-
91
-
92
-
93
-
94
-
95
-
96
-
97
-
98
-
99
-
100
-
101
-
102
-
103
-
104
-
105
-
106
-
107
-
108
-
109
-
110
-
111
-
112
-
113
-
114
-
115
-
116
-
117
-
118
-
119
-
120
-
121
-
122
-
123
-
124
-
125
-
126
-
127
-
128
-
129
-
130
-
131
-
132
-
133
-
134
-
135
-
136
-
137
-
138
-
139
-
140
-
141
-
142
-
143
-
144
-
145
-
146
-
147
-
148
-
149
-
150
-
151
-
152
-
153
-
154
-
155
-
156
-
157
-
158
-
159
-
160
-
161
-
162
-
163
-
164
-
165
-
166
-
167
-
168
-
169
-
170
-
171
-
172
-
173
-
174
-
175
-
176
-
177
-
178
-
179
-
180
-
181
-
182
-
183
-
184
-
185
-
186
-
187
-
188
-
189
-
190
-
191
-
192
-
193
-
194
-
195
-
196
-
197
-
198
-
199
-
200
-
201
-
202
-
203
-
204
-
205
-
206
-
207
-
208
-
209
-
210
-
211
-
212
-
213
-
214
-
215
 |
 |

American Life does not conduct insurance business in Delaware or any other domestic state and, as such, is exempt from RBC requirements by
Delaware law. In addition to Delaware, American Life operations are regulated by applicable authorities of the countries in which it operates and is
subject to capital and solvency requirements in those countries.
The amount of dividends that our insurance subsidiaries can pay to MetLife, Inc. or to other parent entities is constrained by the amount of surplus
we hold to maintain our ratings and provides an additional margin for risk protection and investment in our businesses. We proactively take actions to
maintain capital consistent with these ratings objectives, which may include adjusting dividend amounts and deploying financial resources from internal
or external sources of capital. Certain of these activities may require regulatory approval. Furthermore, the payment of dividends and other distributions
to MetLife, Inc. and other parent entities by their respective insurance subsidiaries is governed by insurance laws and regulations. See “Business —
U.S. Regulation — Insurance Regulation,” and “Business — International Regulation,” in the Form 10-K. See also “— MetLife, Inc. — Liquidity and
Capital Sources — Dividends from Subsidiaries” and Note 16 of the Notes to the Consolidated Financial Statements.
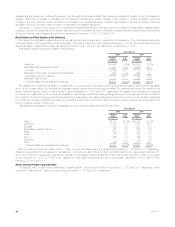
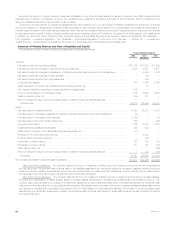
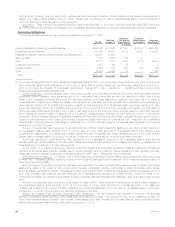
Summary of Primary Sources and Uses of Liquidity and Capital
Our primary sources and uses of liquidity and capital are summarized as follows:
Years Ended December 31,
2012 2011 2010
(In millions)
Sources:
Net cash provided by operating activities .......................................................... $17,160 $10,273 $ 7,985
Net cash provided by changes in policyholder account balances ....................................... 4,290 4,321 4,557
Net cash provided by changes in payables for collateral under securities loaned and other transactions ......... — 6,444 3,076
Net cash provided by changes in bank deposits .................................................... — 96 —
Net cash provided by short-term debt issuances .................................................... — 380 —
Long-term debt issued ........................................................................ 750 1,346 5,090
Cash received in connection with collateral financing arrangements, net .................................. — 37 —
Net change in liability for securitized reverse residential mortgage loans .................................. 1,198 — —
Common stock issued, net of issuance costs ...................................................... 1,000 2,950 3,529
Cash provided by other, net .................................................................... 609 212 —
Effect of change in foreign currency exchange rates on cash and cash equivalents balances ................. 11 — —
Total sources ............................................................................. 25,018 26,059 24,237
Uses:
Net cash used in investing activities .............................................................. 11,929 22,218 18,303
Net cash used for changes in payables for collateral under securities loaned and other transactions ............ 29 — —
Net cash used for changes in bank deposits ....................................................... 4,169 — 32
Net cash used for short-term debt repayments ..................................................... 586 — 606
Long-term debt repaid ........................................................................ 1,702 2,042 1,061
Collateral financing arrangements repaid .......................................................... 349 502 —
Cash paid in connection with collateral financing arrangements, net ..................................... 44 — —
Redemption of convertible preferred stock ......................................................... — 2,805 —
Preferred stock redemption premium ............................................................. — 146 —
Dividends on preferred stock ................................................................... 122 122 122
Dividends on common stock ................................................................... 811 787 784
Cash used in other, net ....................................................................... — — 266
Effect of change in foreign currency exchange rates on cash and cash equivalents balances ................. — 22 129
Total uses ................................................................................ 19,741 28,644 21,303
Net increase (decrease) in cash and cash equivalents ................................................. $ 5,277 $ (2,585) $ 2,934
Cash Flows from Operations. The principal cash inflows from our insurance activities come from insurance premiums, annuity considerations
and deposit funds. The principal cash outflows relate to the liabilities associated with various life insurance, property & casualty, annuity and group
pension products, operating expenses and income tax, as well as interest on outstanding debt obligations. A primary liquidity concern with respect
to these cash flows is the risk of early contractholder and policyholder withdrawal.
Cash Flows from Investments. The principal cash inflows from our investment activities come from repayments of principal on invested assets,
proceeds from maturities of invested assets, sales of invested assets, settlements of freestanding derivatives and net investment income. The
principal cash outflows relate to purchases of investments, issuances of policy loans and settlements of freestanding derivatives. Additional cash
outflows include those related to our securities lending activities. We typically have a net cash outflow from investing activities because cash inflows
from insurance operations are reinvested in accordance with our ALM discipline to fund insurance liabilities. We closely monitor and manage these
risks through our credit risk management process. The primary liquidity concerns with respect to these cash flows are the risk of default by debtors
and market disruption.
56 MetLife, Inc.