MetLife 2012 Annual Report Download - page 147
Download and view the complete annual report
Please find page 147 of the 2012 MetLife annual report below. You can navigate through the pages in the report by either clicking on the pages listed below, or by using the keyword search tool below to find specific information within the annual report.-
 1
1 -
2
-
3
-
4
-
5
-
6
-
7
-
8
-
9
-
10
-
11
-
12
-
13
-
14
-
15
-
16
-
17
-
18
-
19
-
20
-
21
-
22
-
23
-
24
-
25
-
26
-
27
-
28
-
29
-
30
-
31
-
32
-
33
-
34
-
35
-
36
-
37
-
38
-
39
-
40
-
41
-
42
-
43
-
44
-
45
-
46
-
47
-
48
-
49
-
50
-
51
-
52
-
53
-
54
-
55
-
56
-
57
-
58
-
59
-
60
-
61
-
62
-
63
-
64
-
65
-
66
-
67
-
68
-
69
-
70
-
71
-
72
-
73
-
74
-
75
-
76
-
77
-
78
-
79
-
80
-
81
-
82
-
83
-
84
-
85
-
86
-
87
-
88
-
89
-
90
-
91
-
92
-
93
-
94
-
95
-
96
-
97
-
98
-
99
-
100
-
101
-
102
-
103
-
104
-
105
-
106
-
107
-
108
-
109
-
110
-
111
-
112
-
113
-
114
-
115
-
116
-
117
-
118
-
119
-
120
-
121
-
122
-
123
-
124
-
125
-
126
-
127
-
128
-
129
-
130
-
131
-
132
-
133
-
134
-
135
-
136
-
 137
137 -
 138
138 -
 139
139 -
 140
140 -
 141
141 -
 142
142 -
 143
143 -
 144
144 -
 145
145 -
 146
146 -
 147
147 -
 148
148 -
 149
149 -
 150
150 -
 151
151 -
 152
152 -
 153
153 -
 154
154 -
 155
155 -
 156
156 -
 157
157 -
158
-
159
-
160
-
161
-
162
-
163
-
164
-
165
-
166
-
167
-
168
-
169
-
170
-
171
-
172
-
173
-
174
-
175
-
176
-
177
-
178
-
179
-
180
-
181
-
182
-
183
-
184
-
185
-
186
-
187
-
188
-
189
-
190
-
191
-
192
-
193
-
194
-
195
-
196
-
197
-
198
-
199
-
200
-
201
-
202
-
203
-
204
-
205
-
206
-
207
-
208
-
209
-
210
-
211
-
212
-
213
-
214
-
215
 |
 |

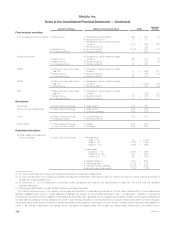
MetLife, Inc.
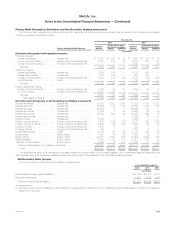
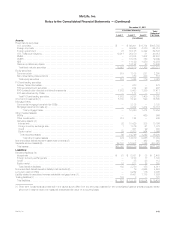
Notes to the Consolidated Financial Statements — (Continued)
December 31, 2011
Fair Value Hierarchy Total
Estimated
Fair ValueLevel 1 Level 2 Level 3
(In millions)
Assets:
Fixed maturity securities:
U.S. corporate .................................................................... $ — $ 99,001 $ 6,784 $105,785
Foreign corporate ................................................................. — 59,648 4,370 64,018
Foreign government ............................................................... 76 50,138 2,322 52,536
U.S. Treasury and agency ........................................................... 19,911 20,070 31 40,012
RMBS .......................................................................... — 41,035 1,602 42,637
CMBS .......................................................................... — 18,316 753 19,069
ABS............................................................................ — 11,129 1,850 12,979
State and political subdivision ........................................................ — 13,182 53 13,235
Total fixed maturity securities ....................................................... 19,987 312,519 17,765 350,271
Equity securities:
Common stock ................................................................... 819 1,105 281 2,205
Non-redeemable preferred stock ..................................................... — 380 438 818
Total equity securities ............................................................. 819 1,485 719 3,023
FVO and trading securities:
Actively Traded Securities ........................................................... — 473 — 473
FVO general account securities ...................................................... — 244 23 267
FVO contractholder-directed unit-linked investments ...................................... 7,572 8,453 1,386 17,411
FVO securities held by CSEs ........................................................ — 117 — 117
Total FVO and trading securities ..................................................... 7,572 9,287 1,409 18,268
Short-term investments (1) ........................................................... 8,150 8,120 590 16,860
Mortgage loans:
Commercial mortgage loans held by CSEs .............................................. — 3,138 — 3,138
Mortgage loans held-for-sale (2) ...................................................... — 9,302 1,414 10,716
Total mortgage loans .......................................................... — 12,440 1,414 13,854
Other invested assets:
MSRs .......................................................................... — — 666 666
Other investments ................................................................. 312 124 — 436
Derivative assets: (4)
Interest rate ..................................................................... 32 10,426 338 10,796
Foreign currency exchange rate ..................................................... 1 1,316 61 1,378
Credit ......................................................................... — 301 29 330
Equity market ................................................................... 29 2,703 964 3,696
Total derivative assets ........................................................... 62 14,746 1,392 16,200
Total other invested assets ..................................................... 374 14,870 2,058 17,302
Net embedded derivatives within asset host contracts (5) ................................... — 1 362 363
Separate account assets (6) .......................................................... 28,191 173,507 1,325 203,023
Total assets ...................................................................... $65,093 $532,229 $25,642 $622,964
Liabilities:
Derivative liabilities: (4)
Interest rate ...................................................................... $ 91 $ 2,351 $ 38 $ 2,480
Foreign currency exchange rate ...................................................... — 1,103 17 1,120
Credit .......................................................................... — 85 28 113
Equity market ..................................................................... 12 211 75 298
Total derivative liabilities ........................................................... 103 3,750 158 4,011
Net embedded derivatives within liability host contracts (5) ................................... — 19 4,565 4,584
Long-term debt of CSEs ............................................................. — 2,952 116 3,068
Liability related to securitized reverse residential mortgage loans (7) ............................ — 6,451 1,175 7,626
Trading liabilities (7) ................................................................. 124 3 — 127
Total liabilities ..................................................................... $ 227 $ 13,175 $ 6,014 $ 19,416
(1) Short-term investments as presented in the tables above differ from the amounts presented in the consolidated balance sheets because certain
short-term investments are not measured at estimated fair value on a recurring basis.
MetLife, Inc. 141