MetLife 2012 Annual Report Download - page 193
Download and view the complete annual report
Please find page 193 of the 2012 MetLife annual report below. You can navigate through the pages in the report by either clicking on the pages listed below, or by using the keyword search tool below to find specific information within the annual report.-
 1
1 -
2
-
3
-
4
-
5
-
6
-
7
-
8
-
9
-
10
-
11
-
12
-
13
-
14
-
15
-
16
-
17
-
18
-
19
-
20
-
21
-
22
-
23
-
24
-
25
-
26
-
27
-
28
-
29
-
30
-
31
-
32
-
33
-
34
-
35
-
36
-
37
-
38
-
39
-
40
-
41
-
42
-
43
-
44
-
45
-
46
-
47
-
48
-
49
-
50
-
51
-
52
-
53
-
54
-
55
-
56
-
57
-
58
-
59
-
60
-
61
-
62
-
63
-
64
-
65
-
66
-
67
-
68
-
69
-
70
-
71
-
72
-
73
-
74
-
75
-
76
-
77
-
78
-
79
-
80
-
81
-
82
-
83
-
84
-
85
-
86
-
87
-
88
-
89
-
90
-
91
-
92
-
93
-
94
-
95
-
96
-
97
-
98
-
99
-
100
-
101
-
102
-
103
-
104
-
105
-
106
-
107
-
108
-
109
-
110
-
111
-
112
-
113
-
114
-
115
-
116
-
117
-
118
-
119
-
120
-
121
-
122
-
123
-
124
-
125
-
126
-
127
-
128
-
129
-
130
-
131
-
132
-
133
-
134
-
135
-
136
-
137
-
138
-
139
-
140
-
141
-
142
-
143
-
144
-
145
-
146
-
147
-
148
-
149
-
150
-
151
-
152
-
153
-
154
-
155
-
156
-
157
-
158
-
159
-
160
-
161
-
162
-
163
-
164
-
165
-
166
-
167
-
168
-
169
-
170
-
171
-
172
-
173
-
174
-
175
-
176
-
177
-
178
-
179
-
180
-
181
-
182
-
 183
183 -
 184
184 -
 185
185 -
 186
186 -
 187
187 -
 188
188 -
 189
189 -
 190
190 -
 191
191 -
 192
192 -
 193
193 -
 194
194 -
 195
195 -
 196
196 -
 197
197 -
 198
198 -
 199
199 -
 200
200 -
 201
201 -
 202
202 -
 203
203 -
204
-
205
-
206
-
207
-
208
-
209
-
210
-
211
-
212
-
213
-
214
-
215
 |
 |

MetLife, Inc.
Notes to the Consolidated Financial Statements — (Continued)
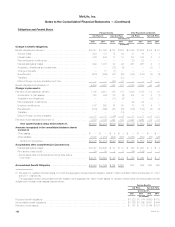
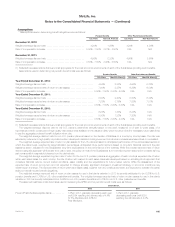
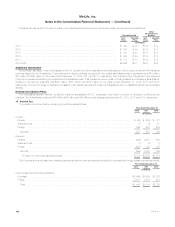
The table below summarizes the actual weighted average allocation of the fair value of total plan assets by asset class at December 31 for the years
indicated and the approved target allocation by major asset class at December 31, 2012 for the Invested Plans:
Pension Postretirement Medical Postretirement Life
Target
Actual Allocation
Target
Actual Allocation
Target
Actual Allocation
2012 2011 2012 2011 2012 2011
Asset Class:
Fixed maturity securities (1) ................ 75% 69% 59% 70% 63% 62% 0% —% —%
Equity securities (2) ...................... 12% 21% 24% 30% 37% 37% 0% —% —%
Alternative securities (3) ................... 13% 10% 17% 0% —% 1% 100% 100% 100%
Total assets .......................... 100% 100% 100% 100% 100% 100%
(1) Fixed maturity securities include ABS, collateralized mortgage obligations, corporate, federal agency, foreign bonds, mortgage-backed securities,
municipals, preferred stocks and U.S. government bonds. Certain prior year amounts have been reclassified from alternative securities into fixed
maturity securities to conform to the current year presentation.
(2) Equity securities primarily include common stock of U.S. companies.
(3) Alternative securities primarily include derivative assets, money market securities, short-term investments, and other investments. Postretirement life’s
target and actual allocation of plan assets are all in short-term investments.
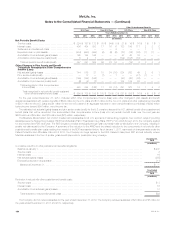
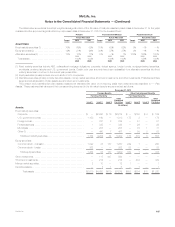
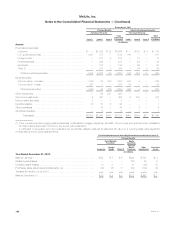
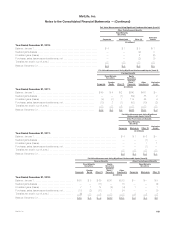
The pension and postretirement plan assets measured at estimated fair value on a recurring basis were determined as described in “— Plan
Assets.” These estimated fair values and their corresponding placement in the fair value hierarchy are summarized as follows:
December 31, 2012
Pension Benefits Other Postretirement Benefits
Fair Value Hierarchy Fair Value Hierarchy
Level 1 Level 2 Level 3
Total
Estimated
Fair Value Level 1 Level 2 Level 3
Total
Estimated
Fair Value
(In millions)
Assets:
Fixed maturity securities:
Corporate .............................................. $ — $2,260 $ 19 $2,279 $ — $165 $ 4 $ 169
U.S. government bonds ................................... 1,153 160 — 1,313 175 3 — 178
Foreign bonds ........................................... — 761 8 769 — 51 — 51
Federal agencies ......................................... 1 335 — 336 — 26 — 26
Municipals .............................................. — 258 — 258 — 70 1 71
Other (1) ............................................... — 490 7 497 — 55 3 58
Total fixed maturity securities .............................. 1,154 4,264 34 5,452 175 370 8 553
Equity securities:
Common stock - domestic ................................. 1,092 38 137 1,267 249 1 — 250
Common stock - foreign ................................... 362 — — 362 83 — — 83
Total equity securities ................................... 1,454 38 137 1,629 332 1 — 333
Other investments .......................................... — 117 447 564 — — — —
Short-term investments ...................................... — 214 — 214 — 432 — 432
Money market securities ..................................... 2 10 — 12 1 — — 1
Derivative assets ........................................... — 7 1 8 — 1 — 1
Total assets ......................................... $2,610 $4,650 $619 $7,879 $508 $804 $ 8 $1,320
MetLife, Inc. 187