MetLife 2012 Annual Report Download - page 132
Download and view the complete annual report
Please find page 132 of the 2012 MetLife annual report below. You can navigate through the pages in the report by either clicking on the pages listed below, or by using the keyword search tool below to find specific information within the annual report.-
 1
1 -
2
-
3
-
4
-
5
-
6
-
7
-
8
-
9
-
10
-
11
-
12
-
13
-
14
-
15
-
16
-
17
-
18
-
19
-
20
-
21
-
22
-
23
-
24
-
25
-
26
-
27
-
28
-
29
-
30
-
31
-
32
-
33
-
34
-
35
-
36
-
37
-
38
-
39
-
40
-
41
-
42
-
43
-
44
-
45
-
46
-
47
-
48
-
49
-
50
-
51
-
52
-
53
-
54
-
55
-
56
-
57
-
58
-
59
-
60
-
61
-
62
-
63
-
64
-
65
-
66
-
67
-
68
-
69
-
70
-
71
-
72
-
73
-
74
-
75
-
76
-
77
-
78
-
79
-
80
-
81
-
82
-
83
-
84
-
85
-
86
-
87
-
88
-
89
-
90
-
91
-
92
-
93
-
94
-
95
-
96
-
97
-
98
-
99
-
100
-
101
-
102
-
103
-
104
-
105
-
106
-
107
-
108
-
109
-
110
-
111
-
112
-
113
-
114
-
115
-
116
-
117
-
118
-
119
-
120
-
121
-
 122
122 -
 123
123 -
 124
124 -
 125
125 -
 126
126 -
 127
127 -
 128
128 -
 129
129 -
 130
130 -
 131
131 -
 132
132 -
 133
133 -
 134
134 -
 135
135 -
 136
136 -
 137
137 -
 138
138 -
 139
139 -
 140
140 -
 141
141 -
 142
142 -
143
-
144
-
145
-
146
-
147
-
148
-
149
-
150
-
151
-
152
-
153
-
154
-
155
-
156
-
157
-
158
-
159
-
160
-
161
-
162
-
163
-
164
-
165
-
166
-
167
-
168
-
169
-
170
-
171
-
172
-
173
-
174
-
175
-
176
-
177
-
178
-
179
-
180
-
181
-
182
-
183
-
184
-
185
-
186
-
187
-
188
-
189
-
190
-
191
-
192
-
193
-
194
-
195
-
196
-
197
-
198
-
199
-
200
-
201
-
202
-
203
-
204
-
205
-
206
-
207
-
208
-
209
-
210
-
211
-
212
-
213
-
214
-
215
 |
 |

MetLife, Inc.
Notes to the Consolidated Financial Statements — (Continued)
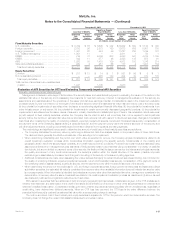
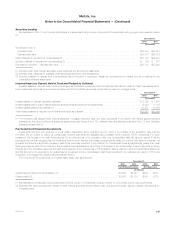
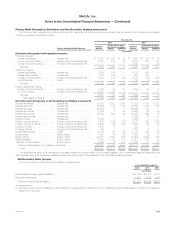
The following table presents information about PCI investments acquired during the periods indicated:
Years Ended December 31,
2012 2011 2012 2011
Fixed Maturity Securities Mortgage Loans
(In millions)
Contractually required payments (including interest) .......................................... $2,083 $5,141 $— $—
Cash flows expected to be collected (1) ................................................... $1,524 $4,365 $— $—
Fair value of investments acquired ........................................................ $ 991 $2,590 $— $—
(1) Represents undiscounted principal and interest cash flow expectations, at the date of acquisition.
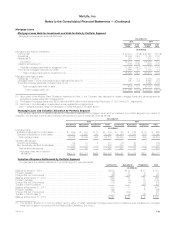
The following table presents activity for the accretable yield on PCI investments for:
Years Ended December 31,
2012 2011 2012 2011
Fixed Maturity Securities Mortgage Loans
(In millions)
Accretable yield, January 1, ............................................................. $2,311 $ 541 $254 $170
Investments purchased ................................................................ 533 1,775 — —
Accretion recognized in earnings ......................................................... (203) (114) (71) (56)
Disposals ........................................................................... (102) (65) — —
Reclassification (to) from nonaccretable difference ........................................... 126 174 1 140
Accretable yield, December 31, .......................................................... $2,665 $2,311 $184 $254
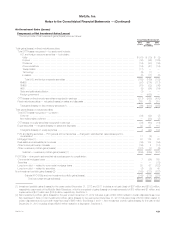
Collectively Significant Equity Method Investments
The Company holds investments in real estate joint ventures, real estate funds and other limited partnership interests consisting of leveraged buy-out
funds, hedge funds, private equity funds, joint ventures and other funds. The portion of these investments accounted for under the equity method had a
carrying value of $10.6 billion at December 31, 2012. The Company’s maximum exposure to loss related to these equity method investments is limited
to the carrying value of these investments plus unfunded commitments of $3.0 billion at December 31, 2012. Except for certain real estate joint
ventures, the Company’s investments in real estate funds and other limited partnership interests are generally of a passive nature in that the Company
does not participate in the management of the entities.
As described in Note 1, the Company generally records its share of earnings in its equity method investments using a three-month lag methodology
and within net investment income. Aggregate net investment income from these equity method investments exceeded 10% of the Company’s
consolidated pre-tax income (loss) from continuing operations for two of the three most recent annual periods: 2012 and 2010. The Company is
providing the following aggregated summarized financial data for such equity method investments, for the most recent annual periods, in order to
provide comparative information. This aggregated summarized financial data does not represent the Company’s proportionate share of the assets,
liabilities, or earnings of such entities.
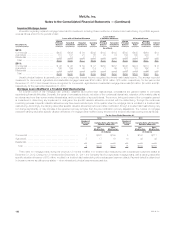
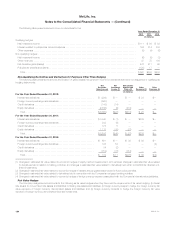
The aggregated summarized financial data presented below reflects the latest available financial information and is as of, and for, the years ended
December 31, 2012, 2011 and 2010. Aggregate total assets of these entities totaled $285.2 billion and $266.4 billion at December 31, 2012 and
2011, respectively. Aggregate total liabilities of these entities totaled $28.8 billion and $31.2 billion at December 31, 2012 and 2011, respectively.
Aggregate net income (loss) of these entities totaled $17.9 billion, $9.7 billion and $18.7 billion for the years ended December 31, 2012, 2011 and
2010, respectively. Aggregate net income (loss) from the underlying entities in which the Company invests is primarily comprised of investment income,
including recurring investment income and realized and unrealized investment gains (losses).
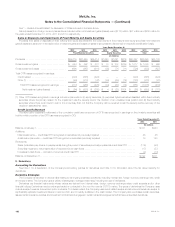
Variable Interest Entities
The Company has invested in certain structured transactions that are VIEs. In certain instances, the Company holds both the power to direct the
most significant activities of the entity, as well as an economic interest in the entity and, as such, is deemed to be the primary beneficiary or consolidator
of the entity.
The determination of the VIE’s primary beneficiary requires an evaluation of the contractual and implied rights and obligations associated with each
party’s relationship with or involvement in the entity, an estimate of the entity’s expected losses and expected residual returns and the allocation of such
estimates to each party involved in the entity. The Company generally uses a qualitative approach to determine whether it is the primary beneficiary.
However, for VIEs that are investment companies or apply measurement principles consistent with those utilized by investment companies, the primary
beneficiary is based on a risks and rewards model and is defined as the entity that will absorb a majority of a VIE’s expected losses, receive a majority of
a VIE’s expected residual returns if no single entity absorbs a majority of expected losses, or both. The Company reassesses its involvement with VIEs
on a quarterly basis. The use of different methodologies, assumptions and inputs in the determination of the primary beneficiary could have a material
effect on the amounts presented within the consolidated financial statements.
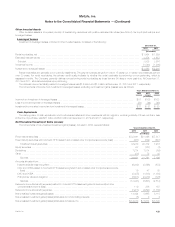
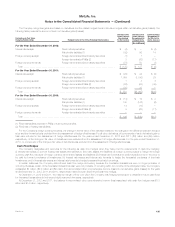
Consolidated VIEs
The following table presents the total assets and total liabilities relating to VIEs for which the Company has concluded that it is the primary beneficiary
and which are consolidated at December 31, 2012 and 2011. Creditors or beneficial interest holders of VIEs where the Company is the primary
beneficiary have no recourse to the general credit of the Company, as the Company’s obligation to the VIEs is limited to the amount of its committed
investment.
126 MetLife, Inc.