MetLife 2012 Annual Report Download - page 45
Download and view the complete annual report
Please find page 45 of the 2012 MetLife annual report below. You can navigate through the pages in the report by either clicking on the pages listed below, or by using the keyword search tool below to find specific information within the annual report.-
 1
1 -
2
-
3
-
4
-
5
-
6
-
7
-
8
-
9
-
10
-
11
-
12
-
13
-
14
-
15
-
16
-
17
-
18
-
19
-
20
-
21
-
22
-
23
-
24
-
25
-
26
-
27
-
28
-
29
-
30
-
31
-
32
-
33
-
34
-
 35
35 -
 36
36 -
 37
37 -
 38
38 -
 39
39 -
 40
40 -
 41
41 -
 42
42 -
 43
43 -
 44
44 -
 45
45 -
 46
46 -
 47
47 -
 48
48 -
 49
49 -
 50
50 -
 51
51 -
 52
52 -
 53
53 -
 54
54 -
 55
55 -
56
-
57
-
58
-
59
-
60
-
61
-
62
-
63
-
64
-
65
-
66
-
67
-
68
-
69
-
70
-
71
-
72
-
73
-
74
-
75
-
76
-
77
-
78
-
79
-
80
-
81
-
82
-
83
-
84
-
85
-
86
-
87
-
88
-
89
-
90
-
91
-
92
-
93
-
94
-
95
-
96
-
97
-
98
-
99
-
100
-
101
-
102
-
103
-
104
-
105
-
106
-
107
-
108
-
109
-
110
-
111
-
112
-
113
-
114
-
115
-
116
-
117
-
118
-
119
-
120
-
121
-
122
-
123
-
124
-
125
-
126
-
127
-
128
-
129
-
130
-
131
-
132
-
133
-
134
-
135
-
136
-
137
-
138
-
139
-
140
-
141
-
142
-
143
-
144
-
145
-
146
-
147
-
148
-
149
-
150
-
151
-
152
-
153
-
154
-
155
-
156
-
157
-
158
-
159
-
160
-
161
-
162
-
163
-
164
-
165
-
166
-
167
-
168
-
169
-
170
-
171
-
172
-
173
-
174
-
175
-
176
-
177
-
178
-
179
-
180
-
181
-
182
-
183
-
184
-
185
-
186
-
187
-
188
-
189
-
190
-
191
-
192
-
193
-
194
-
195
-
196
-
197
-
198
-
199
-
200
-
201
-
202
-
203
-
204
-
205
-
206
-
207
-
208
-
209
-
210
-
211
-
212
-
213
-
214
-
215
 |
 |

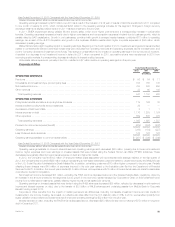
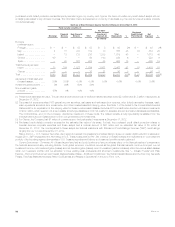
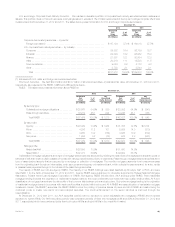
Fair Value of Fixed Maturity and Equity Securities — AFS. Fixed maturity and equity securities AFS measured at estimated fair value on a recurring
basis and their corresponding fair value pricing sources are as follows:
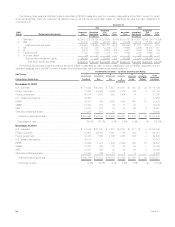
December 31, 2012
Fixed Maturity
Securities Equity
Securities
(In millions)
Level 1:
Quoted prices in active markets for identical assets ............................................. $ 27,441 7.3% $ 932 32.2%
Level 2:
Independent pricing source ................................................................ 285,873 76.4 413 14.3
Internal matrix pricing or discounted cash flow techniques ........................................ 38,532 10.3 937 32.4
Significant other observable inputs ........................................................ 324,405 86.7 1,350 46.7
Level 3:
Independent pricing source ................................................................ 8,294 2.2 492 17.0
Internal matrix pricing or discounted cash flow techniques ........................................ 12,167 3.3 104 3.6
Independent broker quotations ............................................................. 1,959 0.5 13 0.5
Significant unobservable inputs ........................................................... 22,420 6.0 609 21.1
Total estimated fair value .................................................................... $374,266 100.0% $ 2,891 100.0%
See Note 10 of the Notes to the Consolidated Financial Statements for the fixed maturity securities and equity securities AFS fair value hierarchy.
The composition of fair value pricing sources for and significant changes in Level 3 securities at December 31, 2012 are as follows:
‰The majority of the Level 3 fixed maturity and equity securities AFS (92%) were concentrated in five sectors: U.S. and foreign corporate securities,
asset-backed securities (“ABS”), residential mortgage-backed securities (“RMBS”), and foreign government securities.
‰Level 3 fixed maturity securities are priced principally through market standard valuation methodologies, independent pricing services and, to a
much lesser extent, independent non-binding broker quotations using inputs that are not market observable or cannot be derived principally from
or corroborated by observable market data. Level 3 fixed maturity securities consist of less liquid securities with very limited trading activity or
where less price transparency exists around the inputs to the valuation methodologies. Level 3 fixed maturity securities include: alternative
residential mortgage loan (“Alt-A”) and sub-prime RMBS; certain below investment grade private securities and less liquid investment grade
corporate securities (included in U.S. and foreign corporate securities); less liquid ABS and foreign government securities.
‰During the year ended December 31, 2012, Level 3 fixed maturity securities increased by $4.7 billion, or 26%. The increase was driven by net
purchases in excess of sales and an increase in estimated fair value recognized in other comprehensive income (loss) (“OCI”). The net purchases
in excess of sales of fixed maturity securities was concentrated in ABS and foreign corporate securities, and the increase in estimated fair value
recognized in OCI for fixed maturity securities was concentrated in U.S. and foreign corporate securities and RMBS.
See Note 10 of the Notes to the Consolidated Financial Statements for a rollforward of the fair value measurements for fixed maturity securities and
equity securities AFS measured at estimated fair value on a recurring basis using significant unobservable (Level 3) inputs. Total gains and losses in
earnings and OCI are calculated assuming transfers into or out of Level 3 occurred at the beginning of the period. Items transferred into and out of Level
3 during the same period are excluded from the rollforward. Total gains (losses) for fixed maturity securities included in OCI subsequent to their transfer
into Level 3 was $9 million for the year ended December 31, 2012. There were no gains (losses) included in earnings for fixed maturity securities
subsequent to their transfer into Level 3 for the year ended December 31, 2012.
An analysis of transfers into and/or out of Level 3 for the year ended December 31, 2012 is presented in Note 10 of the Notes to Consolidated
Financial Statements.
See “— Summary of Critical Accounting Estimates — Estimated Fair Value of Investments” for further information on the estimates and assumptions
that affect the amounts reported above. See Note 10 of the Notes to the Consolidated Financial Statements for further information about the valuation
techniques and inputs by level by major classes of invested assets that affect the amounts reported above.
Fixed Maturity Securities AFS. See Notes 1 and 8 of the Notes to the Consolidated Financial Statements for further information about fixed maturity
securities AFS.
Fixed Maturity Securities Credit Quality — Ratings. The Securities Valuation Office of the NAIC evaluates the fixed maturity security investments of
insurers for regulatory reporting and capital assessment purposes and assigns securities to one of six credit quality categories called “NAIC
designations.” If no rating is available from the NAIC, then as permitted by the NAIC, an internally developed rating is used. The NAIC ratings are
generally similar to the credit quality designations of the Nationally Recognized Statistical Ratings Organizations (“NRSRO”) for marketable fixed maturity
securities, called “rating agency designations,” except for certain structured securities as described below. Rating agency designations are based on
availability of applicable ratings from rating agencies on the NAIC credit rating provider list, including Moody’s, S&P, Fitch Ratings (“Fitch”), Dominion
Bond Rating Service, A.M. Best Company, Kroll Bond Rating Agency and Realpoint, LLC. If no rating is available from a rating agency, then an internally
developed rating is used.
The NAIC has adopted revised rating methodologies for certain structured securities comprised of non-agency RMBS, commercial mortgage-
backed securities (“CMBS”) and ABS. The NAIC’s objective with the revised rating methodologies for these structured securities was to increase the
accuracy in assessing expected losses, and to use the improved assessment to determine a more appropriate capital requirement for such structured
securities. The revised methodologies reduce regulatory reliance on rating agencies and allow for greater regulatory input into the assumptions used to
estimate expected losses from structured securities. We apply the revised NAIC rating methodologies to structured securities held by MetLife, Inc.’s
insurance subsidiaries that maintain the NAIC statutory basis of accounting. The NAIC’s present methodology is to evaluate structured securities held by
insurers using the revised NAIC rating methodologies on an annual basis. If such insurance subsidiaries of our acquired structured securities that have
not been previously evaluated by the NAIC, but are expected to be evaluated by the NAIC in the upcoming annual review, an internally developed rating
is used until a final rating becomes available.
MetLife, Inc. 39