MetLife 2012 Annual Report Download - page 103
Download and view the complete annual report
Please find page 103 of the 2012 MetLife annual report below. You can navigate through the pages in the report by either clicking on the pages listed below, or by using the keyword search tool below to find specific information within the annual report.-
 1
1 -
2
-
3
-
4
-
5
-
6
-
7
-
8
-
9
-
10
-
11
-
12
-
13
-
14
-
15
-
16
-
17
-
18
-
19
-
20
-
21
-
22
-
23
-
24
-
25
-
26
-
27
-
28
-
29
-
30
-
31
-
32
-
33
-
34
-
35
-
36
-
37
-
38
-
39
-
40
-
41
-
42
-
43
-
44
-
45
-
46
-
47
-
48
-
49
-
50
-
51
-
52
-
53
-
54
-
55
-
56
-
57
-
58
-
59
-
60
-
61
-
62
-
63
-
64
-
65
-
66
-
67
-
68
-
69
-
70
-
71
-
72
-
73
-
74
-
75
-
76
-
77
-
78
-
79
-
80
-
81
-
82
-
83
-
84
-
85
-
86
-
87
-
88
-
89
-
90
-
91
-
92
-
 93
93 -
 94
94 -
 95
95 -
 96
96 -
 97
97 -
 98
98 -
 99
99 -
 100
100 -
 101
101 -
 102
102 -
 103
103 -
 104
104 -
 105
105 -
 106
106 -
 107
107 -
 108
108 -
 109
109 -
 110
110 -
 111
111 -
 112
112 -
 113
113 -
114
-
115
-
116
-
117
-
118
-
119
-
120
-
121
-
122
-
123
-
124
-
125
-
126
-
127
-
128
-
129
-
130
-
131
-
132
-
133
-
134
-
135
-
136
-
137
-
138
-
139
-
140
-
141
-
142
-
143
-
144
-
145
-
146
-
147
-
148
-
149
-
150
-
151
-
152
-
153
-
154
-
155
-
156
-
157
-
158
-
159
-
160
-
161
-
162
-
163
-
164
-
165
-
166
-
167
-
168
-
169
-
170
-
171
-
172
-
173
-
174
-
175
-
176
-
177
-
178
-
179
-
180
-
181
-
182
-
183
-
184
-
185
-
186
-
187
-
188
-
189
-
190
-
191
-
192
-
193
-
194
-
195
-
196
-
197
-
198
-
199
-
200
-
201
-
202
-
203
-
204
-
205
-
206
-
207
-
208
-
209
-
210
-
211
-
212
-
213
-
214
-
215
 |
 |

MetLife, Inc.
Notes to the Consolidated Financial Statements — (Continued)
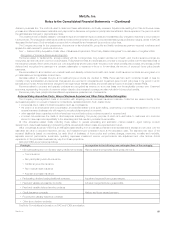
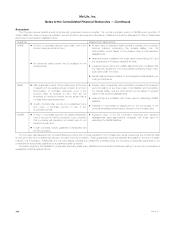
‰Amortization of DAC and VOBA excludes amounts related to: (i) net investment gains (losses) and net derivative gains (losses), (ii) GMIB Fees and
GMIB Costs, and (iii) Market Value Adjustments;
‰Amortization of negative VOBA excludes amounts related to Market Value Adjustments;
‰Interest expense on debt excludes certain amounts related to securitization entities that are VIEs consolidated under GAAP; and
‰Other expenses excludes costs related to: (i) noncontrolling interests, (ii) implementation of new insurance regulatory requirements, and
(iii) acquisition and integration costs.
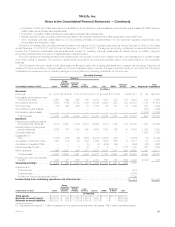
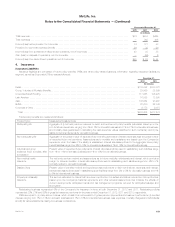
Set forth in the tables below is certain financial information with respect to the Company’s segments, as well as Corporate & Other, for the years
ended December 31, 2012, 2011 and 2010 and at December 31, 2012 and 2011. The segment accounting policies are the same as those used to
prepare the Company’s consolidated financial statements, except for operating earnings adjustments as defined above. In addition, segment
accounting policies include the method of capital allocation described below.
Economic capital is an internally developed risk capital model, the purpose of which is to measure the risk in the business and to provide a basis
upon which capital is deployed. The economic capital model accounts for the unique and specific nature of the risks inherent in the Company’s
business.
The Company’s economic capital model aligns segment allocated equity with emerging standards and consistent risk principles. Segment net
investment income is credited or charged based on the level of allocated equity; however, changes in allocated equity do not impact the Company’s
consolidated net investment income, operating earnings or income (loss) from continuing operations, net of income tax.
Operating Earnings
Americas
Year Ended December 31, 2012 Retail
Group,
Voluntary
& Worksite
Benefits
Corporate
Benefit
Funding Latin
America Total Asia EMEA Corporate
& Other Total Adjustments Total
Consolidated
(In millions)
Revenues
Premiums ................... $ 6,532 $14,794 $ 3,237 $ 2,578 $ 27,141 $ 8,344 $ 2,370 $ 56 $37,911 $ 64 $37,975
Universal life and investment-type
product policy fees .......... 4,561 662 225 785 6,233 1,491 333 155 8,212 344 8,556
Net investment income ......... 7,670 1,768 5,703 1,198 16,339 2,895 535 703 20,472 1,512 21,984
Other revenues ............... 879 422 259 16 1,576 26 121 33 1,756 150 1,906
Net investment gains (losses) .... — — — — — — — — — (352) (352)
Net derivative gains (losses) ..... — — — — — — — — — (1,919) (1,919)
Total revenues .............. 19,642 17,646 9,424 4,577 51,289 12,756 3,359 947 68,351 (201) 68,150
Expenses
Policyholder benefits and claims
and policyholder dividends .... 9,010 13,691 5,704 2,231 30,636 5,819 1,196 119 37,770 1,586 39,356
Interest credited to policyholder
account balances ........... 2,375 167 1,358 393 4,293 1,784 126 39 6,242 1,487 7,729
Goodwill impairment ........... — — — — — — — — — 1,868 1,868
Capitalization of
DAC...................... (1,753) (138) (29) (353) (2,273) (2,288) (723) — (5,284) (5) (5,289)
Amortization of DAC and VOBA . . . 1,607 133 22 224 1,986 1,563 626 2 4,177 22 4,199
Amortization of negative VOBA . . . — — — (5) (5) (456) (94) — (555) (67) (622)
Interest expense on debt ........ — 1 8 (1) 8 5 1 1,176 1,190 166 1,356
Other expenses ............... 5,369 2,351 478 1,375 9,573 4,738 1,810 559 16,680 1,431 18,111
Total expenses ............. 16,608 16,205 7,541 3,864 44,218 11,165 2,942 1,895 60,220 6,488 66,708
Provision for income tax expense
(benefit) ................... 1,032 481 659 130 2,302 554 146 (679) 2,323 (2,195) 128
Operating earnings .......... $ 2,002 $ 960 $ 1,224 $ 583 $ 4,769 $ 1,037 $ 271 $ (269) 5,808
Adjustments to:
Total revenues ............................................................................... (201)
Total expenses ............................................................................... (6,488)
Provision for income tax (expense) benefit .......................................................... 2,195
Income (loss) from continuing operations, net of income tax ....................................... $ 1,314 $ 1,314
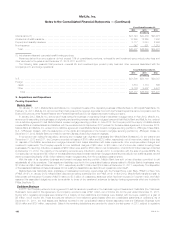
At December 31, 2012 Retail
Group,
Voluntary
& Worksite
Benefits
Corporate
Benefit
Funding Latin
America Asia (1) EMEA Corporate
& Other Total
(In millions)
Total assets ................ $332,387 $44,138 $217,352 $23,272 $131,138 $23,474 $65,020 $836,781
Separate account assets ..... $150,513 $ 532 $ 71,875 $ 4,200 $ 8,273 $ — $ — $235,393
Separate account liabilities ... $150,513 $ 532 $ 71,875 $ 4,200 $ 8,273 $ — $ — $235,393
(1) Total assets includes $111.0 billion of assets from the Japan operations which represents 13% of total consolidated assets.
MetLife, Inc. 97