MetLife 2012 Annual Report Download - page 141
Download and view the complete annual report
Please find page 141 of the 2012 MetLife annual report below. You can navigate through the pages in the report by either clicking on the pages listed below, or by using the keyword search tool below to find specific information within the annual report.-
 1
1 -
2
-
3
-
4
-
5
-
6
-
7
-
8
-
9
-
10
-
11
-
12
-
13
-
14
-
15
-
16
-
17
-
18
-
19
-
20
-
21
-
22
-
23
-
24
-
25
-
26
-
27
-
28
-
29
-
30
-
31
-
32
-
33
-
34
-
35
-
36
-
37
-
38
-
39
-
40
-
41
-
42
-
43
-
44
-
45
-
46
-
47
-
48
-
49
-
50
-
51
-
52
-
53
-
54
-
55
-
56
-
57
-
58
-
59
-
60
-
61
-
62
-
63
-
64
-
65
-
66
-
67
-
68
-
69
-
70
-
71
-
72
-
73
-
74
-
75
-
76
-
77
-
78
-
79
-
80
-
81
-
82
-
83
-
84
-
85
-
86
-
87
-
88
-
89
-
90
-
91
-
92
-
93
-
94
-
95
-
96
-
97
-
98
-
99
-
100
-
101
-
102
-
103
-
104
-
105
-
106
-
107
-
108
-
109
-
110
-
111
-
112
-
113
-
114
-
115
-
116
-
117
-
118
-
119
-
120
-
121
-
122
-
123
-
124
-
125
-
126
-
127
-
128
-
129
-
130
-
 131
131 -
 132
132 -
 133
133 -
 134
134 -
 135
135 -
 136
136 -
 137
137 -
 138
138 -
 139
139 -
 140
140 -
 141
141 -
 142
142 -
 143
143 -
 144
144 -
 145
145 -
 146
146 -
 147
147 -
 148
148 -
 149
149 -
 150
150 -
 151
151 -
152
-
153
-
154
-
155
-
156
-
157
-
158
-
159
-
160
-
161
-
162
-
163
-
164
-
165
-
166
-
167
-
168
-
169
-
170
-
171
-
172
-
173
-
174
-
175
-
176
-
177
-
178
-
179
-
180
-
181
-
182
-
183
-
184
-
185
-
186
-
187
-
188
-
189
-
190
-
191
-
192
-
193
-
194
-
195
-
196
-
197
-
198
-
199
-
200
-
201
-
202
-
203
-
204
-
205
-
206
-
207
-
208
-
209
-
210
-
211
-
212
-
213
-
214
-
215
 |
 |

MetLife, Inc.
Notes to the Consolidated Financial Statements — (Continued)
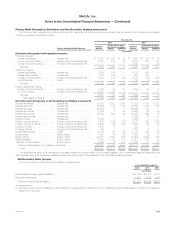
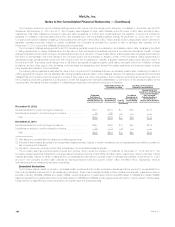
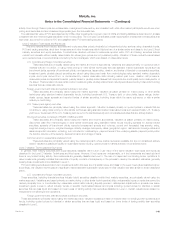
The Company recognizes gains and losses on derivatives and the related hedged items in fair value hedges within net derivative gains (losses). The
following table presents the amount of such net derivative gains (losses):
Derivatives in Fair Value
Hedging Relationships Hedged Items in Fair Value Hedging Relationships
Net Derivative
Gains (Losses)
Recognized
for Derivatives
Net Derivative
Gains (Losses)
Recognized for
Hedged Items
Ineffectiveness
Recognized in
Net Derivative
Gains (Losses)
(In millions)
For the Year Ended December 31, 2012:
Interest rate swaps: Fixed maturity securities $ (4) $ — $ (4)
Policyholder liabilities (1) (82) 96 14
Foreign currency swaps: Foreign-denominated fixed maturity securities (1) 1 —
Foreign-denominated PABs (2) 3 (20) (17)
Foreign currency forwards: Foreign-denominated fixed maturity securities (51) 50 (1)
Total ............................................................................ $ (135) $ 127 $ (8)
For the Year Ended December 31, 2011:
Interest rate swaps: Fixed maturity securities $ (25) $ 22 $ (3)
Policyholder liabilities (1) 1,054 (1,030) 24
Foreign currency swaps: Foreign-denominated fixed maturity securities 1 3 4
Foreign-denominated PABs (2) (24) (25) (49)
Foreign currency forwards: Foreign-denominated fixed maturity securities (25) 25 —
Total ............................................................................ $ 981 $(1,005) $(24)
For the Year Ended December 31, 2010:
Interest rate swaps: Fixed maturity securities $ (14) $ 16 $ 2
Policyholder liabilities (1) 140 (142) (2)
Foreign currency swaps: Foreign-denominated fixed maturity securities 14 (14) —
Foreign-denominated PABs (2) 9 (20) (11)
Foreign currency forwards: Foreign-denominated fixed maturity securities — — —
Total ............................................................................ $ 149 $ (160) $(11)
(1) Fixed rate liabilities reported in PABs or future policy benefits.
(2) Fixed rate or floating rate liabilities.
For the Company’s foreign currency forwards, the change in the fair value of the derivative related to the changes in the difference between the spot
price and the forward price is excluded from the assessment of hedge effectiveness. For all other derivatives, all components of each derivative’s gain or
loss were included in the assessment of hedge effectiveness. For the years ended December 31, 2012 and 2011, ($4) million and ($3) million,
respectively, of the change in fair value of derivatives were excluded from the assessment of hedge effectiveness. For the year ended December 31,
2010, no component of the change in fair value of derivatives was excluded from the assessment of hedge effectiveness.
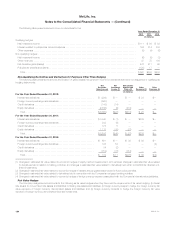
Cash Flow Hedges
The Company designates and accounts for the following as cash flow hedges when they have met the requirements of cash flow hedging:
(i) interest rate swaps to convert floating rate assets and liabilities to fixed rate assets and liabilities; (ii) foreign currency swaps to hedge the foreign
currency cash flow exposure of foreign currency denominated assets and liabilities; (iii) interest rate forwards and credit forwards to lock in the price to
be paid for forward purchases of investments; (iv) interest rate swaps and interest rate forwards to hedge the forecasted purchases of fixed-rate
investments; and (v) interest rate swaps and interest rate forwards to hedge forecasted fixed-rate borrowings.
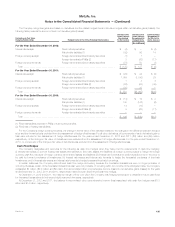
In certain instances, the Company discontinued cash flow hedge accounting because the forecasted transactions were no longer probable of
occurring. Because certain of the forecasted transactions also were not probable of occurring within two months of the anticipated date, the Company
reclassified $1 million, ($13) million and $9 million from accumulated other comprehensive income (loss) into net derivative gains (losses) for the years
ended December 31, 2012, 2011 and 2010, respectively, related to such discontinued cash flow hedges.
At December 31, 2012 and 2011, the maximum length of time over which the Company was hedging its exposure to variability in future cash flows
for forecasted transactions did not exceed eight years and nine years, respectively.
At December 31, 2012 and 2011, the balance in accumulated other comprehensive income (loss) associated with cash flow hedges was $1.3
billion and $1.5 billion, respectively.
MetLife, Inc. 135