MetLife 2012 Annual Report Download - page 50
Download and view the complete annual report
Please find page 50 of the 2012 MetLife annual report below. You can navigate through the pages in the report by either clicking on the pages listed below, or by using the keyword search tool below to find specific information within the annual report.-
 1
1 -
2
-
3
-
4
-
5
-
6
-
7
-
8
-
9
-
10
-
11
-
12
-
13
-
14
-
15
-
16
-
17
-
18
-
19
-
20
-
21
-
22
-
23
-
24
-
25
-
26
-
27
-
28
-
29
-
30
-
31
-
32
-
33
-
34
-
35
-
36
-
37
-
38
-
39
-
 40
40 -
 41
41 -
 42
42 -
 43
43 -
 44
44 -
 45
45 -
 46
46 -
 47
47 -
 48
48 -
 49
49 -
 50
50 -
 51
51 -
 52
52 -
 53
53 -
 54
54 -
 55
55 -
 56
56 -
 57
57 -
 58
58 -
 59
59 -
 60
60 -
61
-
62
-
63
-
64
-
65
-
66
-
67
-
68
-
69
-
70
-
71
-
72
-
73
-
74
-
75
-
76
-
77
-
78
-
79
-
80
-
81
-
82
-
83
-
84
-
85
-
86
-
87
-
88
-
89
-
90
-
91
-
92
-
93
-
94
-
95
-
96
-
97
-
98
-
99
-
100
-
101
-
102
-
103
-
104
-
105
-
106
-
107
-
108
-
109
-
110
-
111
-
112
-
113
-
114
-
115
-
116
-
117
-
118
-
119
-
120
-
121
-
122
-
123
-
124
-
125
-
126
-
127
-
128
-
129
-
130
-
131
-
132
-
133
-
134
-
135
-
136
-
137
-
138
-
139
-
140
-
141
-
142
-
143
-
144
-
145
-
146
-
147
-
148
-
149
-
150
-
151
-
152
-
153
-
154
-
155
-
156
-
157
-
158
-
159
-
160
-
161
-
162
-
163
-
164
-
165
-
166
-
167
-
168
-
169
-
170
-
171
-
172
-
173
-
174
-
175
-
176
-
177
-
178
-
179
-
180
-
181
-
182
-
183
-
184
-
185
-
186
-
187
-
188
-
189
-
190
-
191
-
192
-
193
-
194
-
195
-
196
-
197
-
198
-
199
-
200
-
201
-
202
-
203
-
204
-
205
-
206
-
207
-
208
-
209
-
210
-
211
-
212
-
213
-
214
-
215
 |
 |

Securities Lending
We participate in a securities lending program whereby blocks of securities, which are included in fixed maturity securities, equity securities and
short-term investments, are loaned to third parties, primarily brokerage firms and commercial banks. We obtain collateral, usually cash, in an amount
generally equal to 102% of the estimated fair value of the securities loaned, which is obtained at the inception of a loan and maintained at a level greater
than or equal to 100% for the duration of the loan. Securities loaned under such transactions may be sold or repledged by the transferee. We are liable
to return to our counterparties the cash collateral under our control. These transactions are treated as financing arrangements and the associated cash
collateral liability is recorded at the amount of the cash received.
See “— Liquidity and Capital Resources — The Company — Liquidity and Capital Uses — Securities Lending” and Note 8 of the Notes to the
Consolidated Financial Statements for financial information regarding our securities lending program.
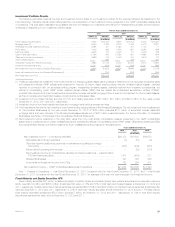
Mortgage Loans
Our mortgage loans are principally collateralized by commercial real estate, agricultural real estate and residential properties. The carrying value of
mortgage loans was $57.0 billion and $72.1 billion, or 10.7% and 13.8% of total cash and invested assets, at December 31, 2012 and 2011,
respectively. See Note 8 of the Notes to the Consolidated Financial Statements for a table that presents our mortgage loans held-for-investment of
$56.6 billion and $56.9 billion by portfolio segment at December 31, 2012 and 2011, respectively, as well as the components of the mortgage loans
held-for-sale of $414 million and $15.2 billion at December 31, 2012 and 2011, respectively. We originated $9.6 billion and $11.1 billion of commercial
mortgage loans during the years ended December 31, 2012 and 2011, respectively. We originated $3.0 billion and $2.8 billion of agricultural mortgage
loans during the years ended December 31, 2012 and 2011, respectively. The information presented below excludes the effects of consolidating
certain VIEs that are treated as CSEs and securitized reverse residential mortgage loans. Such amounts are presented in the aforementioned table.
We diversify our mortgage loan portfolio by both geographic region and property type to reduce the risk of concentration. Of our commercial and
agricultural mortgage loans, 89% are collateralized by properties located in the U.S., with the remaining 11% collateralized by properties located outside
the U.S., calculated as a percent of the total mortgage loans held-for-investment (excluding commercial mortgage loans held by CSEs) at
December 31, 2012. The carrying value of our commercial and agricultural mortgage loans located in California, New York and Texas were 19%, 11%
and 7%, respectively, of total mortgage loans held for investment (excluding commercial mortgage loans held by CSEs) at December 31, 2012.
Additionally, we manage risk when originating commercial and agricultural mortgage loans by generally lending only up to 75% of the estimated fair value
of the underlying real estate collateral.
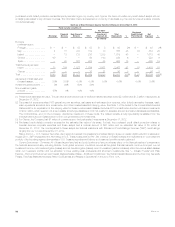
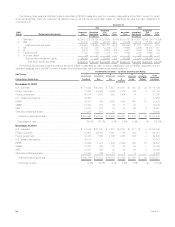
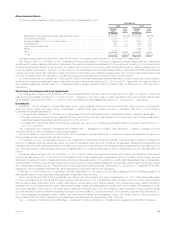
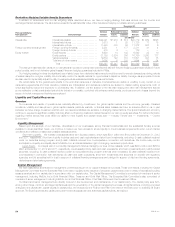
Commercial Mortgage Loans by Geographic Region and Property Type. Commercial mortgage loans are the largest component of the mortgage
loan invested asset class, as it represented approximately 75% of total mortgage loans held-for-investment (excluding the effects of consolidating
certain VIEs that are treated as CSEs) at both December 31, 2012 and 2011. The tables below present the diversification across geographic regions
and property types of commercial mortgage loans held-for-investment:
December 31,
2012 2011
Amount %of
Total Amount %of
Total
(In millions) (In millions)
Region:
South Atlantic ....................................................... $ 7,969 19.7% $ 9,022 22.3%
Pacific ............................................................. 7,932 19.6 8,209 20.3
Middle Atlantic ....................................................... 6,780 16.7 6,370 15.8
International ......................................................... 5,567 13.8 4,713 11.7
West South Central ................................................... 3,436 8.5 3,220 8.0
East North Central .................................................... 3,026 7.5 2,984 7.3
New England ........................................................ 1,489 3.7 1,563 3.9
Mountain ........................................................... 906 2.2 746 1.8
East South Central .................................................... 457 1.1 487 1.2
West North Central ................................................... 288 0.7 365 0.9
Multi-Region and Other ................................................ 2,622 6.5 2,761 6.8
Total recorded investment ............................................. 40,472 100.0% 40,440 100.0%
Less: valuation allowances ........................................... 293 398
Carrying value, net of valuation allowances ............................... $40,179 $40,042
Property Type:
Office .............................................................. $18,012 44.5% $18,582 45.9%
Retail .............................................................. 9,445 23.3 9,524 23.6
Apartment .......................................................... 3,944 9.8 4,011 9.9
Hotel .............................................................. 3,355 8.3 3,114 7.7
Industrial ........................................................... 3,159 7.8 3,102 7.7
Other .............................................................. 2,557 6.3 2,107 5.2
Total recorded investment ............................................. 40,472 100.0% 40,440 100.0%
Less: valuation allowances ........................................... 293 398
Carrying value, net of valuation allowances ............................... $40,179 $40,042
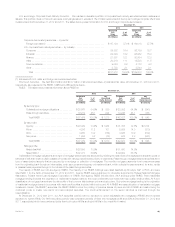
Mortgage Loan Credit Quality — Restructured, Potentially Delinquent, Delinquent or Under Foreclosure. We monitor our mortgage loan investments
on an ongoing basis, including reviewing loans that are restructured, potentially delinquent, and delinquent or under foreclosure. These loan classifications
are consistent with those used in industry practice.
We define restructured mortgage loans as loans in which we, for economic or legal reasons related to the debtor’s financial difficulties, grant a
concession to the debtor that we would not otherwise consider. We define potentially delinquent loans as loans that, in management’s opinion, have a
high probability of becoming delinquent in the near term. We define delinquent mortgage loans consistent with industry practice, when interest and
44 MetLife, Inc.