MetLife 2012 Annual Report Download - page 148
Download and view the complete annual report
Please find page 148 of the 2012 MetLife annual report below. You can navigate through the pages in the report by either clicking on the pages listed below, or by using the keyword search tool below to find specific information within the annual report.-
 1
1 -
2
-
3
-
4
-
5
-
6
-
7
-
8
-
9
-
10
-
11
-
12
-
13
-
14
-
15
-
16
-
17
-
18
-
19
-
20
-
21
-
22
-
23
-
24
-
25
-
26
-
27
-
28
-
29
-
30
-
31
-
32
-
33
-
34
-
35
-
36
-
37
-
38
-
39
-
40
-
41
-
42
-
43
-
44
-
45
-
46
-
47
-
48
-
49
-
50
-
51
-
52
-
53
-
54
-
55
-
56
-
57
-
58
-
59
-
60
-
61
-
62
-
63
-
64
-
65
-
66
-
67
-
68
-
69
-
70
-
71
-
72
-
73
-
74
-
75
-
76
-
77
-
78
-
79
-
80
-
81
-
82
-
83
-
84
-
85
-
86
-
87
-
88
-
89
-
90
-
91
-
92
-
93
-
94
-
95
-
96
-
97
-
98
-
99
-
100
-
101
-
102
-
103
-
104
-
105
-
106
-
107
-
108
-
109
-
110
-
111
-
112
-
113
-
114
-
115
-
116
-
117
-
118
-
119
-
120
-
121
-
122
-
123
-
124
-
125
-
126
-
127
-
128
-
129
-
130
-
131
-
132
-
133
-
134
-
135
-
136
-
137
-
 138
138 -
 139
139 -
 140
140 -
 141
141 -
 142
142 -
 143
143 -
 144
144 -
 145
145 -
 146
146 -
 147
147 -
 148
148 -
 149
149 -
 150
150 -
 151
151 -
 152
152 -
 153
153 -
 154
154 -
 155
155 -
 156
156 -
 157
157 -
 158
158 -
159
-
160
-
161
-
162
-
163
-
164
-
165
-
166
-
167
-
168
-
169
-
170
-
171
-
172
-
173
-
174
-
175
-
176
-
177
-
178
-
179
-
180
-
181
-
182
-
183
-
184
-
185
-
186
-
187
-
188
-
189
-
190
-
191
-
192
-
193
-
194
-
195
-
196
-
197
-
198
-
199
-
200
-
201
-
202
-
203
-
204
-
205
-
206
-
207
-
208
-
209
-
210
-
211
-
212
-
213
-
214
-
215
 |
 |

MetLife, Inc.
Notes to the Consolidated Financial Statements — (Continued)
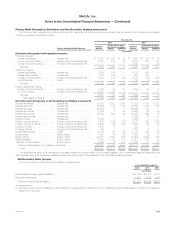
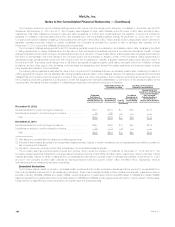
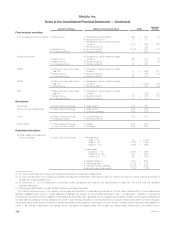
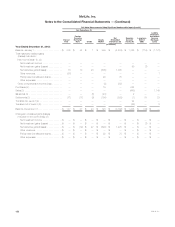
(2) Mortgage loans held-for-sale are comprised of securitized reverse residential mortgage loans and residential mortgage loans held-for-sale. See “—
Fair Value Option” for additional information. The amounts in the preceding tables differ from the amount presented in the consolidated balance
sheets as these tables do not include mortgage loans that are stated at lower of amortized cost or estimated fair value.
(3) As a result of the MetLife Bank Divestiture described in Note 3, the Company disposed of certain mortgage loans and de-recognized its securitized
reverse residential mortgage loans and corresponding liabilities presented in the table above and in the related fair value option disclosures.
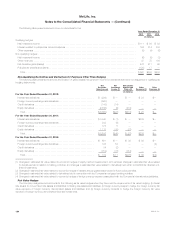
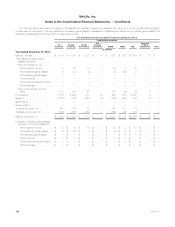
(4) Derivative liabilities are presented within other liabilities in the consolidated balance sheets. The amounts are presented gross in the tables above to
reflect the presentation in the consolidated balance sheets, but are presented net for purposes of the rollforward in the Fair Value Measurements
Using Significant Unobservable Inputs (Level 3) tables.
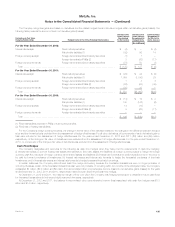
(5) Net embedded derivatives within asset host contracts are presented primarily within premiums, reinsurance and other receivables in the
consolidated balance sheets. Net embedded derivatives within liability host contracts are presented primarily within PABs in the consolidated
balance sheets. At December 31, 2012, fixed maturity securities and equity securities also included embedded derivatives of $0 and ($88) million,
respectively. At December 31, 2011, fixed maturity securities and equity securities included embedded derivatives of $2 million and ($72) million,
respectively.
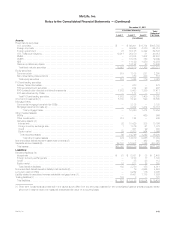
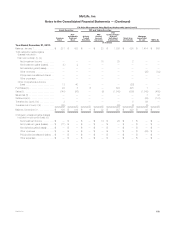
(6) Investment performance related to separate account assets is fully offset by corresponding amounts credited to contractholders whose liabilityis
reflected within separate account liabilities. Separate account liabilities are set equal to the estimated fair value of separate account assets.
(7) The liability related to securitized reverse residential mortgage loans and trading liabilities are presented within other liabilities in the consolidated
balance sheets.
The following describes the valuation methodologies used to measure assets and liabilities at fair value. The description includes the valuation
techniques and key inputs for each category of assets or liabilities that are classified within Level 2 and Level 3 of the fair value hierarchy.
Investments
Valuation Controls and Procedures
On behalf of the Company’s Chief Investment Officer and Chief Financial Officer, a pricing and valuation committee that is independent of the
trading and investing functions and comprised of senior management, provides oversight of control systems and valuation policies for securities,
mortgage loans and derivatives. On a monthly basis, this committee reviews and approves new transaction types and markets, ensures that
observable market prices and market-based parameters are used for valuation, wherever possible, determines that judgmental valuation
adjustments, when applied, are based upon established policies and are applied consistently over time. This committee also provides oversight of
the selection of independent third party pricing providers and the controls and procedures to evaluate third party pricing. Periodically, the Chief
Accounting Officer reports to the Audit Committee of MetLife, Inc.’s Board of Directors regarding compliance with fair value accounting standards.
The Company reviews its valuation methodologies on an ongoing basis and revises those methodologies when necessary based on changing
market conditions. Assurance is gained on the overall reasonableness and consistent application of input assumptions, valuation methodologies and
compliance with fair value accounting standards through controls designed to ensure valuations represent an exit price. Several controls are utilized,
including certain monthly controls, which include, but are not limited to, analysis of portfolio returns to corresponding benchmark returns, comparing
a sample of executed prices of securities sold to the fair value estimates, comparing fair value estimates to management’s knowledge of the current
market, reviewing the bid/ask spreads to assess activity, comparing prices from multiple independent pricing services and ongoing due diligence to
confirm that independent pricing services use market-based parameters. The process includes a determination of the observability of inputs used in
estimated fair values received from independent pricing services or brokers by assessing whether these inputs can be corroborated by observable
market data. The Company ensures that prices received from independent brokers, also referred to herein as “consensus pricing,” represent a
reasonable estimate of fair value by reviewing such pricing with the Company’s knowledge of the current market dynamics and current pricing for
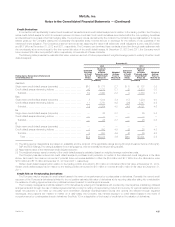
similar financial instruments. While independent non-binding broker quotations are utilized, they are not used for a significant portion of the portfolio.
For example, fixed maturity securities priced using independent non-binding broker quotations represent 0.5% of the total estimated fair value of
fixed maturity securities and 9% of the total estimated fair value of Level 3 fixed maturity securities.
The Company also applies a formal process to challenge any prices received from independent pricing services that are not considered
representative of estimated fair value. If prices received from independent pricing services are not considered reflective of market activity or
representative of estimated fair value, independent non-binding broker quotations are obtained, or an internally developed valuation is prepared.
Internally developed valuations of current estimated fair value, which reflect internal estimates of liquidity and nonperformance risks, compared with
pricing received from the independent pricing services, did not produce material differences in the estimated fair values for the majority of the
portfolio; accordingly, overrides were not material. This is, in part, because internal estimates of liquidity and nonperformance risks are generally
based on available market evidence and estimates used by other market participants. In the absence of such market-based evidence,
management’s best estimate is used.
Securities, Short-term Investments, Other Investments, Long-term Debt of CSEs and Trading Liabilities
When available, the estimated fair value of these investments are based on quoted prices in active markets that are readily and regularly
obtainable. Generally, these are the most liquid of the Company’s securities holdings and valuation of these securities does not involve
management’s judgment.
When quoted prices in active markets are not available, the determination of estimated fair value is based on market standard valuation
methodologies, giving priority to observable inputs. The significant inputs to the market standard valuation methodologies for certain types of
securities with reasonable levels of price transparency are inputs that are observable in the market or can be derived principally from, or corroborated
by, observable market data. When observable inputs are not available, the market standard valuation methodologies rely on inputs that are significant
to the estimated fair value that are not observable in the market or cannot be derived principally from, or corroborated by, observable market data.
These unobservable inputs can be based in large part on management’s judgment or estimation and cannot be supported by reference to market
142 MetLife, Inc.