MetLife 2012 Annual Report Download - page 188
Download and view the complete annual report
Please find page 188 of the 2012 MetLife annual report below. You can navigate through the pages in the report by either clicking on the pages listed below, or by using the keyword search tool below to find specific information within the annual report.-
 1
1 -
2
-
3
-
4
-
5
-
6
-
7
-
8
-
9
-
10
-
11
-
12
-
13
-
14
-
15
-
16
-
17
-
18
-
19
-
20
-
21
-
22
-
23
-
24
-
25
-
26
-
27
-
28
-
29
-
30
-
31
-
32
-
33
-
34
-
35
-
36
-
37
-
38
-
39
-
40
-
41
-
42
-
43
-
44
-
45
-
46
-
47
-
48
-
49
-
50
-
51
-
52
-
53
-
54
-
55
-
56
-
57
-
58
-
59
-
60
-
61
-
62
-
63
-
64
-
65
-
66
-
67
-
68
-
69
-
70
-
71
-
72
-
73
-
74
-
75
-
76
-
77
-
78
-
79
-
80
-
81
-
82
-
83
-
84
-
85
-
86
-
87
-
88
-
89
-
90
-
91
-
92
-
93
-
94
-
95
-
96
-
97
-
98
-
99
-
100
-
101
-
102
-
103
-
104
-
105
-
106
-
107
-
108
-
109
-
110
-
111
-
112
-
113
-
114
-
115
-
116
-
117
-
118
-
119
-
120
-
121
-
122
-
123
-
124
-
125
-
126
-
127
-
128
-
129
-
130
-
131
-
132
-
133
-
134
-
135
-
136
-
137
-
138
-
139
-
140
-
141
-
142
-
143
-
144
-
145
-
146
-
147
-
148
-
149
-
150
-
151
-
152
-
153
-
154
-
155
-
156
-
157
-
158
-
159
-
160
-
161
-
162
-
163
-
164
-
165
-
166
-
167
-
168
-
169
-
170
-
171
-
172
-
173
-
174
-
175
-
176
-
177
-
 178
178 -
 179
179 -
 180
180 -
 181
181 -
 182
182 -
 183
183 -
 184
184 -
 185
185 -
 186
186 -
 187
187 -
 188
188 -
 189
189 -
 190
190 -
 191
191 -
 192
192 -
 193
193 -
 194
194 -
 195
195 -
 196
196 -
 197
197 -
 198
198 -
199
-
200
-
201
-
202
-
203
-
204
-
205
-
206
-
207
-
208
-
209
-
210
-
211
-
212
-
213
-
214
-
215
 |
 |

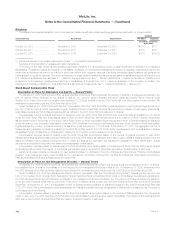
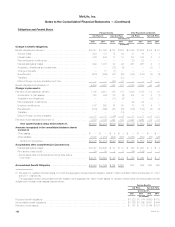
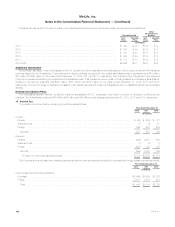
MetLife, Inc.
Notes to the Consolidated Financial Statements — (Continued)
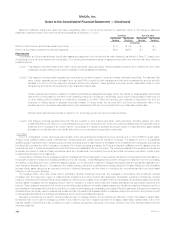
Obligations and Funded Status
Pension Benefits Other Postretirement Benefits
U.S. Plans (1) Non-U.S. Plans U.S. Plans Non-U.S. Plans
December 31,
2012 2011 2012 2011 2012 2011 2012 2011
(In millions)
Change in benefit obligations:
Benefit obligations at January 1, ................................. $8,327 $ 7,043 $ 773 $ 676 $ 2,093 $1,808 $ 39 $ 37
Service costs .............................................. 224 187 75 64 21 16 1 1
Interest costs .............................................. 406 404 17 16 103 106 2 2
Plan participants’ contributions ................................ — — — — 29 28 — —
Net actuarial (gains) losses ................................... 999 1,072 32 24 261 267 4 2
Acquisition, divestitures and curtailments ........................ — — (12) (5) — — (3) 1
Change in benefits ......................................... — 17 (1) — — — — —
Benefits paid .............................................. (476) (396) (41) (30) (132) (132) (2) (4)
Transfers ................................................. — — — (13) — — — —
Effect of foreign currency translation and other .................... — — (20) 41 — — 2 —
Benefit obligations at December 31, .............................. 9,480 8,327 823 773 2,375 2,093 43 39
Change in plan assets:
Fair value of plan assets at January 1, ............................ 7,108 6,310 185 178 1,240 1,185 13 15
Actual return on plan assets .................................. 740 944 20 (4) 105 80 2 (1)
Acquisition and divestitures ................................... — — (11) (4) — — (3) —
Plan participants’ contributions ................................ — — — — 29 28 — —
Employer contributions ...................................... 507 250 74 55 78 79 4 1
Benefits paid .............................................. (476) (396) (41) (30) (132) (132) (2) (2)
Transfers ................................................. — — — (13) — — — —
Effect of foreign currency translation ............................ — — (3) 3 — — 1 —
Fair value of plan assets at December 31, ......................... 7,879 7,108 224 185 1,320 1,240 15 13
Over (under) funded status at December 31, $(1,601) $(1,219) $(599) $(588) $(1,055) $ (853) $ (28) $ (26)
Amounts recognized in the consolidated balance sheets
consist of:
Other assets .............................................. $ — $ — $ 6 $ 3 $ — $ — $ — $ —
Other liabilities ............................................. (1,601) (1,219) (605) (591) (1,055) (853) (28) (26)
Net amount recognized .................................... $(1,601) $(1,219) $(599) $(588) $(1,055) $ (853) $ (28) $ (26)
Accumulated other comprehensive (income) loss:
Net actuarial (gains) losses ................................... $3,047 $ 2,498 $ 27 $ 10 $ 799 $ 623 $ 3 $ 2
Prior service costs (credit) .................................... 24 30 2 2 (74) (179) 1 1
Accumulated other comprehensive (income) loss, before
income tax .............................................. $3,071 $ 2,528 $ 29 $ 12 $ 725 $ 444 $ 4 $ 3
Accumulated Benefit Obligation ............................. $ 8,866 $ 7,849 $ 724 $ 658 N/A N/A N/A N/A
(1) Includes non-qualified unfunded plans, for which the aggregate projected benefit obligation was $1.1 billion and $997 million at December 31, 2012
and 2011, respectively.
The aggregate pension accumulated benefit obligation and aggregate fair value of plan assets for pension benefit plans with accumulated benefit
obligations in excess of plan assets was as follows:
Pension Benefits
U.S. Plans Non-U.S. Plans
December 31,
2012 2011 2012 2011
(In millions)
Projected benefit obligations ..................................................................... $1,323 $ 1,164 $ 690 $ 708
Accumulated benefit obligations .................................................................. $1,166 $ 1,045 $ 651 $ 644
Fair value of plan assets ......................................................................... $ 157 $ 131 $144 $121
182 MetLife, Inc.