MetLife 2012 Annual Report Download - page 39
Download and view the complete annual report
Please find page 39 of the 2012 MetLife annual report below. You can navigate through the pages in the report by either clicking on the pages listed below, or by using the keyword search tool below to find specific information within the annual report.-
 1
1 -
2
-
3
-
4
-
5
-
6
-
7
-
8
-
9
-
10
-
11
-
12
-
13
-
14
-
15
-
16
-
17
-
18
-
19
-
20
-
21
-
22
-
23
-
24
-
25
-
26
-
27
-
28
-
 29
29 -
 30
30 -
 31
31 -
 32
32 -
 33
33 -
 34
34 -
 35
35 -
 36
36 -
 37
37 -
 38
38 -
 39
39 -
 40
40 -
 41
41 -
 42
42 -
 43
43 -
 44
44 -
 45
45 -
 46
46 -
 47
47 -
 48
48 -
 49
49 -
50
-
51
-
52
-
53
-
54
-
55
-
56
-
57
-
58
-
59
-
60
-
61
-
62
-
63
-
64
-
65
-
66
-
67
-
68
-
69
-
70
-
71
-
72
-
73
-
74
-
75
-
76
-
77
-
78
-
79
-
80
-
81
-
82
-
83
-
84
-
85
-
86
-
87
-
88
-
89
-
90
-
91
-
92
-
93
-
94
-
95
-
96
-
97
-
98
-
99
-
100
-
101
-
102
-
103
-
104
-
105
-
106
-
107
-
108
-
109
-
110
-
111
-
112
-
113
-
114
-
115
-
116
-
117
-
118
-
119
-
120
-
121
-
122
-
123
-
124
-
125
-
126
-
127
-
128
-
129
-
130
-
131
-
132
-
133
-
134
-
135
-
136
-
137
-
138
-
139
-
140
-
141
-
142
-
143
-
144
-
145
-
146
-
147
-
148
-
149
-
150
-
151
-
152
-
153
-
154
-
155
-
156
-
157
-
158
-
159
-
160
-
161
-
162
-
163
-
164
-
165
-
166
-
167
-
168
-
169
-
170
-
171
-
172
-
173
-
174
-
175
-
176
-
177
-
178
-
179
-
180
-
181
-
182
-
183
-
184
-
185
-
186
-
187
-
188
-
189
-
190
-
191
-
192
-
193
-
194
-
195
-
196
-
197
-
198
-
199
-
200
-
201
-
202
-
203
-
204
-
205
-
206
-
207
-
208
-
209
-
210
-
211
-
212
-
213
-
214
-
215
 |
 |

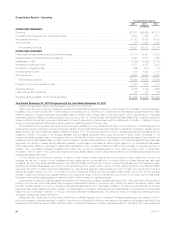
Year Ended December 31, 2011 Compared with the Year Ended December 31, 2010
Unless otherwise stated, all amounts discussed below are net of income tax.
Operating earnings increased by $258 million over 2010 as a result of the inclusion of a full year of results of ALICO’s operations for 2011 compared
to one month of results for 2010, which contributed $295 million to the operating earnings increase for the segment. Changes in foreign currency
exchange rates had a slightly positive impact on 2011 results compared to the prior year.
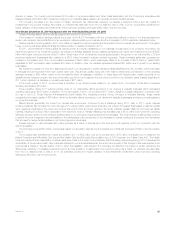
In 2011, EMEA experienced strong variable life and annuity sales, which drove higher premiums and a corresponding increase in policyholder
benefits. Operating expenses increased primarily due to higher commissions and compensation expenses in Ireland due to business growth, which is
partially offset by DAC capitalization. Growth in our businesses, combined with growth in average invested assets, contributed $11 million to operating
earnings. As a result of the ALICO Acquisition and growth in the business, EMEA‘s results reflect higher corporate expenses of $44 million, which
decreased operating earnings.
Market factors had a slight negative impact to operating earnings. Beginning in the fourth quarter of 2010, investment earnings and interest credited
related to contractholder-directed unit-linked investments were excluded from operating revenues and operating expenses, as the contractholder, and
not the Company, directs the investment of the funds. This change in presentation had no impact on operating earnings in the current period; however,
it resulted in a decrease in net investment income in Ireland in 2011, when compared to 2010, as positive returns were experienced in 2010 from
recovering equity markets. A corresponding decrease is reflected in interest credited expense.
Unfavorable claims experience, primarily in the U.K., resulted in a $7 million decline in operating earnings from the prior year.
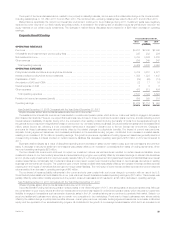
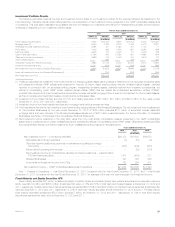
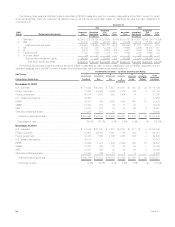
Corporate & Other
Years Ended December 31,
2012 2011 2010
(In millions)
OPERATING REVENUES
Premiums ....................................................................................... $ 56 $ 54 $ 11
Universal life and investment-type product policy fees ..................................................... 155 155 138
Net investment income ............................................................................. 703 888 650
Other revenues ................................................................................... 33 60 109
Total operating revenues .......................................................................... 947 1,157 908
OPERATING EXPENSES
Policyholder benefits and claims and policyholder dividends ................................................ 119 126 33
Interest credited to policyholder account balances ........................................................ 39 — —
Amortization of DAC and VOBA ...................................................................... 2 1 1
Interest expense on debt ........................................................................... 1,176 1,293 1,124
Other expenses .................................................................................. 559 505 379
Total operating expenses ......................................................................... 1,895 1,925 1,537
Provision for income tax expense (benefit) .............................................................. (679) (584) (402)
Operating earnings ................................................................................ (269) (184) (227)
Less: Preferred stock dividends ...................................................................... 122 122 122
Operating earnings available to common shareholders .................................................... $ (391) $ (306) $ (349)
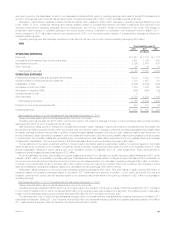
Year Ended December 31, 2012 Compared with the Year Ended December 31, 2011
Unless otherwise stated, all amounts discussed below are net of income tax.
Operating earnings available to common shareholders and operating earnings each decreased $85 million, primarily due to lower net investment
income, higher expenses and lower earnings on invested assets that were funded using the Federal Home Loan Bank (“FHLB”) advances. These
decreases were partially offset by lower interest expense on debt and higher tax credits.
In 2012, the Company incurred $103 million of employee-related costs associated with its enterprise-wide strategic initiative. In the first quarterof
2012, the Company also incurred a $26 million charge representing a multi–state examination payment related to unclaimed property and MetLife’s use
of the U.S. Social Security Administration’s Death Master File. In addition, advertising costs were $10 million higher compared to the prior year. Partially
offsetting these charges were $40 million of expenses incurred in the prior year related to the liquidation plan filed by the Department of Financial
Services for ELNY. In addition, the current year included $15 million of lower rent expense and $12 million of lower internal resource costs for associates
committed to the ALICO Acquisition.
Net investment income decreased $31 million, excluding the FHLB which is discussed below and the divested MetLife Bank operations, driven by
an increase in the amount credited to the segments due to growth in the economic capital managed by Corporate & Other on their behalf and lower
returns from our alternative investments, partially offset by higher returns on real estate joint ventures.
Operating earnings on invested assets that were funded using the FHLB advances decreased $35 million, reflected by decreases in net investment
income and interest expense on debt, due to the transfer of $3.8 billion of FHLB advances and underlying assets from MetLife Bank to Corporate
Benefit Funding in April 2012.
Corporate & Other benefits from the impact of certain permanent tax differences, including non-taxable investment income and tax credits for
investments in low income housing. As a result, our effective tax rates differ from the U.S. statutory rate of 35%. In 2012, we benefited primarily from
higher utilization of tax preferenced investments which improved operating earnings by $32 million from the prior year.
Interest expense on debt, excluding the FHLB which is discussed above, decreased $25 million primarily due to maturity of $750 million in long-term
debt in December 2011.
MetLife, Inc. 33