MetLife 2012 Annual Report Download - page 83
Download and view the complete annual report
Please find page 83 of the 2012 MetLife annual report below. You can navigate through the pages in the report by either clicking on the pages listed below, or by using the keyword search tool below to find specific information within the annual report.-
 1
1 -
2
-
3
-
4
-
5
-
6
-
7
-
8
-
9
-
10
-
11
-
12
-
13
-
14
-
15
-
16
-
17
-
18
-
19
-
20
-
21
-
22
-
23
-
24
-
25
-
26
-
27
-
28
-
29
-
30
-
31
-
32
-
33
-
34
-
35
-
36
-
37
-
38
-
39
-
40
-
41
-
42
-
43
-
44
-
45
-
46
-
47
-
48
-
49
-
50
-
51
-
52
-
53
-
54
-
55
-
56
-
57
-
58
-
59
-
60
-
61
-
62
-
63
-
64
-
65
-
66
-
67
-
68
-
69
-
70
-
71
-
72
-
 73
73 -
 74
74 -
 75
75 -
 76
76 -
 77
77 -
 78
78 -
 79
79 -
 80
80 -
 81
81 -
 82
82 -
 83
83 -
 84
84 -
 85
85 -
 86
86 -
 87
87 -
 88
88 -
 89
89 -
 90
90 -
 91
91 -
 92
92 -
 93
93 -
94
-
95
-
96
-
97
-
98
-
99
-
100
-
101
-
102
-
103
-
104
-
105
-
106
-
107
-
108
-
109
-
110
-
111
-
112
-
113
-
114
-
115
-
116
-
117
-
118
-
119
-
120
-
121
-
122
-
123
-
124
-
125
-
126
-
127
-
128
-
129
-
130
-
131
-
132
-
133
-
134
-
135
-
136
-
137
-
138
-
139
-
140
-
141
-
142
-
143
-
144
-
145
-
146
-
147
-
148
-
149
-
150
-
151
-
152
-
153
-
154
-
155
-
156
-
157
-
158
-
159
-
160
-
161
-
162
-
163
-
164
-
165
-
166
-
167
-
168
-
169
-
170
-
171
-
172
-
173
-
174
-
175
-
176
-
177
-
178
-
179
-
180
-
181
-
182
-
183
-
184
-
185
-
186
-
187
-
188
-
189
-
190
-
191
-
192
-
193
-
194
-
195
-
196
-
197
-
198
-
199
-
200
-
201
-
202
-
203
-
204
-
205
-
206
-
207
-
208
-
209
-
210
-
211
-
212
-
213
-
214
-
215
 |
 |

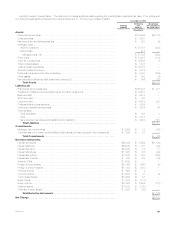
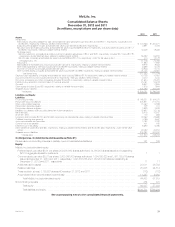
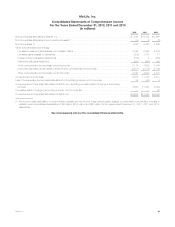
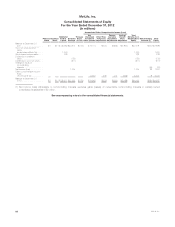
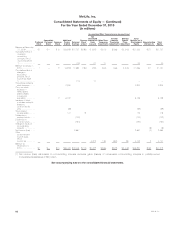
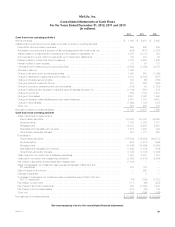
MetLife, Inc.
Consolidated Balance Sheets
December 31, 2012 and 2011
(In millions, except share and per share data)
2012 2011
Assets
Investments:
Fixed maturity securities available-for-sale, at estimated fair value (amortized cost: $340,870 and $329,811, respectively; includes $3,378
and $3,225, respectively, relating to variable interest entities) .............................................................. $ 374,266 $ 350,271
Equity securities available-for-sale, at estimated fair value (cost: $2,838 and $3,208, respectively) ................................... 2,891 3,023
Fair value option and trading securities, at estimated fair value (includes $659 and $473, respectively, of actively traded securities; and $112
and $280, respectively, relating to variable interest entities) ................................................................ 16,348 18,268
Mortgage loans:
Held-for-investment, principally at amortized cost (net of valuation allowances of $347 and $481, respectively; includes $2,715 and $3,187,
respectively, at estimated fair value, relating to variable interest entities) ..................................................... 56,592 56,915
Held-for-sale, principally at estimated fair value (includes $49 and $10,716, respectively, under the fair value option) ................... 414 15,178
Mortgage loans, net ............................................................................................. 57,006 72,093
Policy loans ...................................................................................................... 11,884 11,892
Real estate and real estate joint ventures (includes $10 and $15, respectively, relating to variable interest entities) ....................... 9,918 8,563
Other limited partnership interests (includes $274 and $259, respectively, relating to variable interest entities) .......................... 6,688 6,378
Short-term investments, principally at estimated fair value .................................................................. 16,906 17,310
Other invested assets, principally at estimated fair value (includes $81 and $98, respectively, relating to variable interest entities) ........... 21,145 23,581
Total investments ............................................................................................ 517,052 511,379
Cash and cash equivalents, principally at estimated fair value (includes $99 and $176, respectively, relating to variable interest entities) ....... 15,738 10,461
Accrued investment income (includes $13 and $16, respectively, relating to variable interest entities) .................................. 4,374 4,344
Premiums, reinsurance and other receivables (includes $5 and $12, respectively, relating to variable interest entities) ..................... 21,634 22,481
Deferred policy acquisition costs and value of business acquired .............................................................. 24,761 24,619
Goodwill ......................................................................................................... 9,953 11,935
Other assets (includes $5 and $5, respectively, relating to variable interest entities) ................................................ 7,876 7,984
Separate account assets ............................................................................................. 235,393 203,023
Total assets ................................................................................................. $ 836,781 $ 796,226
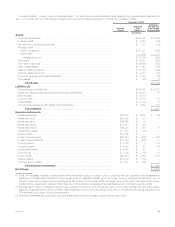
Liabilities and Equity
Liabilities
Future policy benefits ................................................................................................ $ 192,351 $ 184,275
Policyholder account balances ........................................................................................ 225,821 217,700
Other policy-related balances ......................................................................................... 15,463 15,599
Policyholder dividends payable ........................................................................................ 728 774
Policyholder dividend obligation ........................................................................................ 3,828 2,919
Payables for collateral under securities loaned and other transactions .......................................................... 33,687 33,716
Bank deposits ..................................................................................................... 6,416 10,507
Short-term debt .................................................................................................... 100 686
Long-term debt (includes $2,527 and $3,068, respectively, at estimated fair value, relating to variable interest entities) .................... 19,062 23,692
Collateral financing arrangements ...................................................................................... 4,196 4,647
Junior subordinated debt securities ..................................................................................... 3,192 3,192
Current income tax payable ........................................................................................... 401 193
Deferred income tax liability ........................................................................................... 8,693 6,395
Other liabilities (includes $40 and $60, respectively, relating to variable interest entities; and $0 and $7,626, respectively, under the fair value
option) ......................................................................................................... 22,492 30,914
Separate account liabilities ........................................................................................... 235,393 203,023
Total liabilities ................................................................................................ 771,823 738,232
Contingencies, Commitments and Guarantees (Note 21)
Redeemable noncontrolling interests in partially-owned consolidated subsidiaries ................................... 121 105
Equity
MetLife, Inc.’s stockholders’ equity: .......................................................................
Preferred stock, par value $0.01 per share; 200,000,000 shares authorized: 84,000,000 shares issued and outstanding;
$2,100 aggregate liquidation preference ............................................................... 1 1
Common stock, par value $0.01 per share; 3,000,000,000 shares authorized; 1,094,880,623 and 1,061,150,915 shares
issued at December 31, 2012 and 2011, respectively; 1,091,686,736 and 1,057,957,028 shares outstanding at
December 31, 2012 and 2011, respectively ............................................................ 11 11
Additional paid-in capital .............................................................................. 28,011 26,782
Retained earnings ................................................................................... 25,205 24,814
Treasury stock, at cost; 3,193,887 shares at December 31, 2012 and 2011 ..................................... (172) (172)
Accumulated other comprehensive income (loss) .......................................................... 11,397 6,083
Total MetLife, Inc.’s stockholders’ equity .............................................................. 64,453 57,519
Noncontrolling interests ................................................................................ 384 370
Total equity .................................................................................... 64,837 57,889
Total liabilities and equity .......................................................................... $836,781 $796,226
See accompanying notes to the consolidated financial statements.
MetLife, Inc. 77