MetLife 2012 Annual Report Download - page 122
Download and view the complete annual report
Please find page 122 of the 2012 MetLife annual report below. You can navigate through the pages in the report by either clicking on the pages listed below, or by using the keyword search tool below to find specific information within the annual report.-
 1
1 -
2
-
3
-
4
-
5
-
6
-
7
-
8
-
9
-
10
-
11
-
12
-
13
-
14
-
15
-
16
-
17
-
18
-
19
-
20
-
21
-
22
-
23
-
24
-
25
-
26
-
27
-
28
-
29
-
30
-
31
-
32
-
33
-
34
-
35
-
36
-
37
-
38
-
39
-
40
-
41
-
42
-
43
-
44
-
45
-
46
-
47
-
48
-
49
-
50
-
51
-
52
-
53
-
54
-
55
-
56
-
57
-
58
-
59
-
60
-
61
-
62
-
63
-
64
-
65
-
66
-
67
-
68
-
69
-
70
-
71
-
72
-
73
-
74
-
75
-
76
-
77
-
78
-
79
-
80
-
81
-
82
-
83
-
84
-
85
-
86
-
87
-
88
-
89
-
90
-
91
-
92
-
93
-
94
-
95
-
96
-
97
-
98
-
99
-
100
-
101
-
102
-
103
-
104
-
105
-
106
-
107
-
108
-
109
-
110
-
111
-
 112
112 -
 113
113 -
 114
114 -
 115
115 -
 116
116 -
 117
117 -
 118
118 -
 119
119 -
 120
120 -
 121
121 -
 122
122 -
 123
123 -
 124
124 -
 125
125 -
 126
126 -
 127
127 -
 128
128 -
 129
129 -
 130
130 -
 131
131 -
 132
132 -
133
-
134
-
135
-
136
-
137
-
138
-
139
-
140
-
141
-
142
-
143
-
144
-
145
-
146
-
147
-
148
-
149
-
150
-
151
-
152
-
153
-
154
-
155
-
156
-
157
-
158
-
159
-
160
-
161
-
162
-
163
-
164
-
165
-
166
-
167
-
168
-
169
-
170
-
171
-
172
-
173
-
174
-
175
-
176
-
177
-
178
-
179
-
180
-
181
-
182
-
183
-
184
-
185
-
186
-
187
-
188
-
189
-
190
-
191
-
192
-
193
-
194
-
195
-
196
-
197
-
198
-
199
-
200
-
201
-
202
-
203
-
204
-
205
-
206
-
207
-
208
-
209
-
210
-
211
-
212
-
213
-
214
-
215
 |
 |

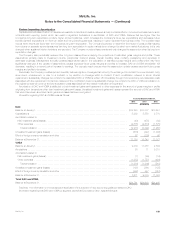
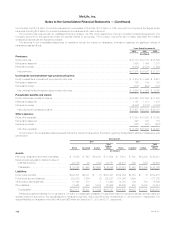
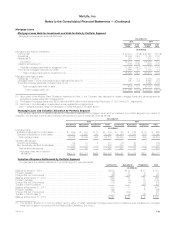
MetLife, Inc.
Notes to the Consolidated Financial Statements — (Continued)
December 31, 2012 December 31, 2011
Cost or
Amortized
Cost
Gross Unrealized Estimated
Fair
Value
Cost or
Amortized
Cost
Gross Unrealized Estimated
Fair
ValueGains Temporary
Losses OTTI
Losses Gains Temporary
Losses OTTI
Losses
(In millions)
Fixed Maturity Securities:
U.S. corporate .......................... $102,669 $11,887 $ 430 $ — $114,126 $ 98,621 $ 8,544 $1,380 $ — $105,785
Foreign corporate (1) ..................... 61,806 5,654 277 (1) 67,184 61,568 3,789 1,338 1 64,018
Foreign government ...................... 51,967 5,440 71 — 57,336 49,840 3,053 357 — 52,536
U.S. Treasury and agency ................. 41,874 6,104 11 — 47,967 34,132 5,882 2 — 40,012
RMBS ................................ 35,666 2,477 315 349 37,479 42,092 2,281 1,033 703 42,637
CMBS ................................ 18,177 1,009 57 — 19,129 18,565 730 218 8 19,069
ABS .................................. 15,762 404 156 13 15,997 13,018 278 305 12 12,979
State and political subdivision .............. 12,949 2,169 70 — 15,048 11,975 1,416 156 — 13,235
Total fixed maturity securities .............. $340,870 $35,144 $1,387 $361 $374,266 $329,811 $25,973 $4,789 $724 $350,271
Equity Securities:
Common .............................. $ 2,034 $ 147 $ 19 $ — $ 2,162 $ 2,219 $ 83 $ 97 $ — $ 2,205
Non-redeemable preferred ................. 804 65 140 — 729 989 31 202 — 818
Total equity securities ................... $ 2,838 $ 212 $ 159 $ — $ 2,891 $ 3,208 $ 114 $ 299 $ — $ 3,023
(1) OTTI losses, as presented above, represent the noncredit portion of OTTI losses that is included in AOCI. OTTI losses include both the initial
recognition of noncredit losses, and the effects of subsequent increases and decreases in estimated fair value for those fixed maturity securities
that were previously noncredit loss impaired. The noncredit loss component of OTTI losses for foreign corporate securities was in an unrealized
gain position of $1 million at December 31, 2012 due to increases in estimated fair value subsequent to initial recognition of noncredit losses on
such securities. See also “—Net Unrealized Investment Gains (Losses).”
The Company held non-income producing fixed maturity securities with an estimated fair value of $85 million and $62 million with unrealized gains
(losses) of $11 million and ($19) million at December 31, 2012 and 2011, respectively.
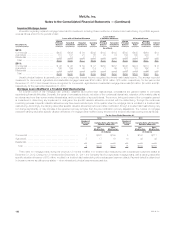
Methodology for Amortization of Discount or Premium on Structured Securities
Amortization of the discount or premium on structured securities considers the estimated timing and amount of prepayments of the underlying loans.
Actual prepayment experience is periodically reviewed and effective yields are recalculated when differences arise between the originally anticipated and
the actual prepayments received and currently anticipated. Prepayment assumptions for single class and multi-class mortgage-backed and ABS are
estimated using inputs obtained from third-party specialists and based on management’s knowledge of the current market. For credit-sensitive
mortgage-backed and ABS and certain prepayment-sensitive securities, the effective yield is recalculated on a prospective basis. For all other
mortgage-backed and ABS, the effective yield is recalculated on a retrospective basis.
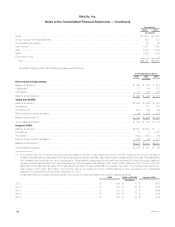
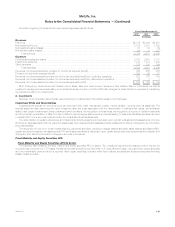
Maturities of Fixed Maturity Securities
The amortized cost and estimated fair value of fixed maturity securities, by contractual maturity date, were as follows at:
December 31,
2012 2011
Amortized
Cost
Estimated
Fair
Value Amortized
Cost
Estimated
Fair
Value
(In millions)
Due in one year or less ............................................................ $ 24,177 $ 24,394 $ 16,747 $ 16,862
Due after one year through five years ................................................. 66,973 70,759 62,819 64,414
Due after five years through ten years ................................................. 82,376 91,975 82,694 88,036
Due after ten years ............................................................... 97,739 114,533 93,876 106,274
Subtotal....................................................................... 271,265 301,661 256,136 275,586
Structured securities (RMBS, CMBS and ABS) .......................................... 69,605 72,605 73,675 74,685
Total fixed maturity securities ...................................................... $340,870 $374,266 $329,811 $350,271
Actual maturities may differ from contractual maturities due to the exercise of call or prepayment options. Fixed maturity securities not due at a single
maturity date have been presented in the year of final contractual maturity. RMBS, CMBS and ABS are shown separately, as they are not due at a single
maturity.
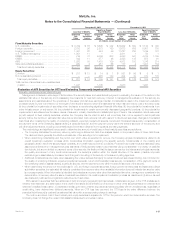
Continuous Gross Unrealized Losses for Fixed Maturity and Equity Securities AFS by Sector
The following table presents the estimated fair value and gross unrealized losses of fixed maturity and equity securities AFS in an unrealized loss
position, aggregated by sector and by length of time that the securities have been in a continuous unrealized loss position. The unrealized loss amounts
include the noncredit component of OTTI loss.
116 MetLife, Inc.