MetLife 2012 Annual Report Download - page 84
Download and view the complete annual report
Please find page 84 of the 2012 MetLife annual report below. You can navigate through the pages in the report by either clicking on the pages listed below, or by using the keyword search tool below to find specific information within the annual report.-
 1
1 -
2
-
3
-
4
-
5
-
6
-
7
-
8
-
9
-
10
-
11
-
12
-
13
-
14
-
15
-
16
-
17
-
18
-
19
-
20
-
21
-
22
-
23
-
24
-
25
-
26
-
27
-
28
-
29
-
30
-
31
-
32
-
33
-
34
-
35
-
36
-
37
-
38
-
39
-
40
-
41
-
42
-
43
-
44
-
45
-
46
-
47
-
48
-
49
-
50
-
51
-
52
-
53
-
54
-
55
-
56
-
57
-
58
-
59
-
60
-
61
-
62
-
63
-
64
-
65
-
66
-
67
-
68
-
69
-
70
-
71
-
72
-
73
-
 74
74 -
 75
75 -
 76
76 -
 77
77 -
 78
78 -
 79
79 -
 80
80 -
 81
81 -
 82
82 -
 83
83 -
 84
84 -
 85
85 -
 86
86 -
 87
87 -
 88
88 -
 89
89 -
 90
90 -
 91
91 -
 92
92 -
 93
93 -
 94
94 -
95
-
96
-
97
-
98
-
99
-
100
-
101
-
102
-
103
-
104
-
105
-
106
-
107
-
108
-
109
-
110
-
111
-
112
-
113
-
114
-
115
-
116
-
117
-
118
-
119
-
120
-
121
-
122
-
123
-
124
-
125
-
126
-
127
-
128
-
129
-
130
-
131
-
132
-
133
-
134
-
135
-
136
-
137
-
138
-
139
-
140
-
141
-
142
-
143
-
144
-
145
-
146
-
147
-
148
-
149
-
150
-
151
-
152
-
153
-
154
-
155
-
156
-
157
-
158
-
159
-
160
-
161
-
162
-
163
-
164
-
165
-
166
-
167
-
168
-
169
-
170
-
171
-
172
-
173
-
174
-
175
-
176
-
177
-
178
-
179
-
180
-
181
-
182
-
183
-
184
-
185
-
186
-
187
-
188
-
189
-
190
-
191
-
192
-
193
-
194
-
195
-
196
-
197
-
198
-
199
-
200
-
201
-
202
-
203
-
204
-
205
-
206
-
207
-
208
-
209
-
210
-
211
-
212
-
213
-
214
-
215
 |
 |

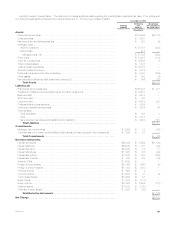
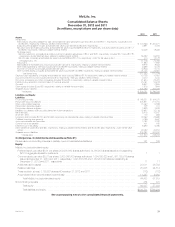
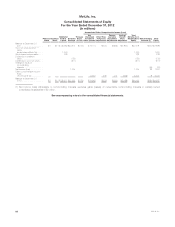
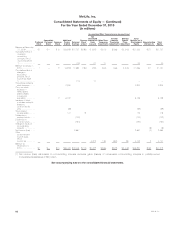
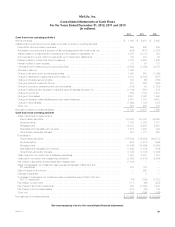
MetLife, Inc.
Consolidated Statements of Operations
For the Years Ended December 31, 2012, 2011 and 2010
(In millions, except per share data)
2012 2011 2010
Revenues
Premiums ...................................................................... $37,975 $36,361 $27,071
Universal life and investment-type product policy fees ..................................... 8,556 7,806 6,028
Net investment income ............................................................ 21,984 19,585 17,493
Other revenues .................................................................. 1,906 2,532 2,328
Net investment gains (losses): .......................................................
Other-than-temporary impairments on fixed maturity securities ............................ (346) (924) (682)
Other-than-temporary impairments on fixed maturity securities transferred to other comprehensive
income (loss) ................................................................ 29 (31) 212
Other net investment gains (losses) ................................................. (35) 88 62
Total net investment gains (losses) ................................................ (352) (867) (408)
Net derivative gains (losses) ....................................................... (1,919) 4,824 (265)
Total revenues ............................................................ 68,150 70,241 52,247
Expenses
Policyholder benefits and claims ..................................................... 37,987 35,471 29,187
Interest credited to policyholder account balances ....................................... 7,729 5,603 4,919
Policyholder dividends ............................................................. 1,369 1,446 1,485
Goodwill impairment .............................................................. 1,868 — —
Other expenses .................................................................. 17,755 18,537 12,927
Total expenses ............................................................ 66,708 61,057 48,518
Income (loss) from continuing operations before provision for income tax ...................... 1,442 9,184 3,729
Provision for income tax expense (benefit) .............................................. 128 2,793 1,110
Income (loss) from continuing operations, net of income tax ................................ 1,314 6,391 2,619
Income (loss) from discontinued operations, net of income tax .............................. 48 24 44
Net income (loss) ................................................................. 1,362 6,415 2,663
Less: Net income (loss) attributable to noncontrolling interests .............................. 38 (8) (4)
Net income (loss) attributable to MetLife, Inc. ........................................... 1,324 6,423 2,667
Less: Preferred stock dividends ..................................................... 122 122 122
Preferred stock redemption premium ............................................. — 146 —
Net income (loss) available to MetLife, Inc.’s common shareholders .......................... $ 1,202 $ 6,155 $ 2,545
Income (loss) from continuing operations, net of income tax, available to MetLife, Inc.’s common
shareholders per common share:
Basic ......................................................................... $ 1.08 $ 5.79 $ 2.83
Diluted ....................................................................... $ 1.08 $ 5.74 $ 2.81
Net income (loss) available to MetLife, Inc.’s common shareholders per common share:
Basic ......................................................................... $ 1.12 $ 5.81 $ 2.88
Diluted ....................................................................... $ 1.12 $ 5.76 $ 2.86
Cash dividends declared per common share ............................................ $ 0.74 $ 0.74 $ 0.74
See accompanying notes to the consolidated financial statements.
78 MetLife, Inc.