MetLife 2012 Annual Report Download - page 139
Download and view the complete annual report
Please find page 139 of the 2012 MetLife annual report below. You can navigate through the pages in the report by either clicking on the pages listed below, or by using the keyword search tool below to find specific information within the annual report.-
 1
1 -
2
-
3
-
4
-
5
-
6
-
7
-
8
-
9
-
10
-
11
-
12
-
13
-
14
-
15
-
16
-
17
-
18
-
19
-
20
-
21
-
22
-
23
-
24
-
25
-
26
-
27
-
28
-
29
-
30
-
31
-
32
-
33
-
34
-
35
-
36
-
37
-
38
-
39
-
40
-
41
-
42
-
43
-
44
-
45
-
46
-
47
-
48
-
49
-
50
-
51
-
52
-
53
-
54
-
55
-
56
-
57
-
58
-
59
-
60
-
61
-
62
-
63
-
64
-
65
-
66
-
67
-
68
-
69
-
70
-
71
-
72
-
73
-
74
-
75
-
76
-
77
-
78
-
79
-
80
-
81
-
82
-
83
-
84
-
85
-
86
-
87
-
88
-
89
-
90
-
91
-
92
-
93
-
94
-
95
-
96
-
97
-
98
-
99
-
100
-
101
-
102
-
103
-
104
-
105
-
106
-
107
-
108
-
109
-
110
-
111
-
112
-
113
-
114
-
115
-
116
-
117
-
118
-
119
-
120
-
121
-
122
-
123
-
124
-
125
-
126
-
127
-
128
-
 129
129 -
 130
130 -
 131
131 -
 132
132 -
 133
133 -
 134
134 -
 135
135 -
 136
136 -
 137
137 -
 138
138 -
 139
139 -
 140
140 -
 141
141 -
 142
142 -
 143
143 -
 144
144 -
 145
145 -
 146
146 -
 147
147 -
 148
148 -
 149
149 -
150
-
151
-
152
-
153
-
154
-
155
-
156
-
157
-
158
-
159
-
160
-
161
-
162
-
163
-
164
-
165
-
166
-
167
-
168
-
169
-
170
-
171
-
172
-
173
-
174
-
175
-
176
-
177
-
178
-
179
-
180
-
181
-
182
-
183
-
184
-
185
-
186
-
187
-
188
-
189
-
190
-
191
-
192
-
193
-
194
-
195
-
196
-
197
-
198
-
199
-
200
-
201
-
202
-
203
-
204
-
205
-
206
-
207
-
208
-
209
-
210
-
211
-
212
-
213
-
214
-
215
 |
 |

MetLife, Inc.
Notes to the Consolidated Financial Statements — (Continued)
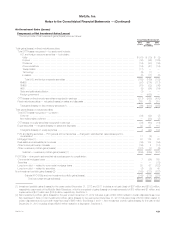
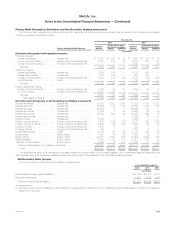
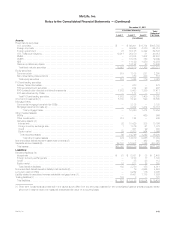
Primary Risks Managed by Derivatives and Non-Derivative Hedging Instruments
The following table presents the gross notional amount, estimated fair value and primary underlying risk exposure of the Company’s derivatives,
excluding embedded derivatives, held at:
Primary Underlying Risk Exposure
December 31,
2012 2011
Notional
Amount
Estimated Fair Value Notional
Amount
Estimated Fair Value
Assets Liabilities Assets Liabilities
(In millions)
Derivatives Designated as Hedging Instruments
Fair value hedges:
Interest rate swaps ............... Interest rate ................... $ 5,397 $ 1,921 $ 90 $ 4,580 $ 1,884 $ 92
Foreign currency swaps ........... Foreign currency exchange rate . . . 3,187 332 85 3,220 500 98
Foreign currency forwards ......... Foreign currency exchange rate . . . — — — 1,830 2 10
Subtotal .................................................... 8,584 2,253 175 9,630 2,386 200
Cash flow hedges:
Interest rate swaps ............... Interest rate ................... 3,642 705 — 3,230 947 —
Interest rate forwards ............. Interest rate ................... 675 139 — 965 210 —
Foreign currency swaps ........... Foreign currency exchange rate . . . 9,038 219 355 6,370 352 306
Credit forwards .................. Credit ....................... — — — 20 4 —
Subtotal .................................................... 13,355 1,063 355 10,585 1,513 306
Foreign operations hedges:
Foreign currency forwards ......... Foreign currency exchange rate . . . 2,552 43 61 1,689 53 12
Currency options ................ Foreign currency exchange rate . . . 4,375 43 3 — — —
Subtotal .................................................... 6,927 86 64 1,689 53 12
Total qualifying hedges ....................................... 28,866 3,402 594 21,904 3,952 518
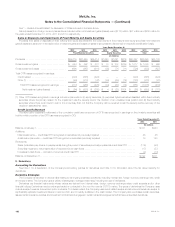
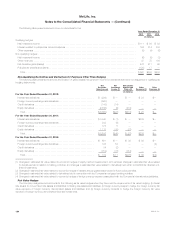
Derivatives Not Designated or Not Qualifying as Hedging Instruments
Interest rate swaps ................. Interest rate ................... 83,250 5,201 2,043 71,923 5,410 2,107
Interest rate floors .................. Interest rate ................... 56,246 1,174 837 23,866 1,246 165
Interest rate caps .................. Interest rate ................... 49,465 74 — 49,665 102 —
Interest rate futures ................. Interest rate ................... 11,684 1 38 14,965 25 19
Interest rate options ................ Interest rate ................... 16,328 640 60 16,988 896 6
Interest rate forwards ............... Interest rate ................... — — — 13,068 76 91
Synthetic GICs .................... Interest rate ................... 4,162 — — 4,454 — —
Foreign currency swaps ............. Foreign currency exchange rate . . . 8,208 199 736 6,871 320 656
Foreign currency forwards ........... Foreign currency exchange rate . . . 9,202 26 288 6,630 145 38
Currency futures ................... Foreign currency exchange rate . . . 1,408 4 — 633 — —
Currency options .................. Foreign currency exchange rate . . . 129 1 — 1,321 6 —
Credit default swaps ............... Credit ....................... 12,553 90 39 13,136 326 113
Equity futures ..................... Equity market ................. 7,008 14 132 7,053 26 10
Equity options ..................... Equity market ................. 22,920 2,825 356 17,099 3,263 179
Variance swaps ................... Equity market ................. 19,830 122 310 18,801 397 75
Total rate of return swaps ............ Equity market ................. 3,092 4 103 1,644 10 34
Total non-designated or non-qualifying derivatives ...................... 305,485 10,375 4,942 268,117 12,248 3,493
Total ....................................................... $334,351 $13,777 $5,536 $290,021 $16,200 $4,011
The estimated fair value of all derivatives in an asset position is reported within other invested assets in the consolidated balance sheets and the
estimated fair value of all derivatives in a liability position is reported within other liabilities in the consolidated balance sheets.
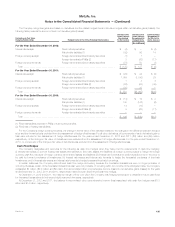
Net Derivative Gains (Losses)
The components of net derivative gains (losses) were as follows:
Years Ended December 31,
2012 2011 2010
(In millions)
Derivatives and hedging gains (losses) (1) .............................................................. $(3,158) $ 6,108 $ 122
Embedded derivatives .............................................................................. 1,239 (1,284) (387)
Total net derivative gains (losses) ................................................................... $(1,919) $ 4,824 $(265)
(1) Includes foreign currency transaction gains (losses) on hedged items in cash flow and non-qualifying hedging relationships, which are not presented
elsewhere in this note.
MetLife, Inc. 133