MetLife 2012 Annual Report Download - page 198
Download and view the complete annual report
Please find page 198 of the 2012 MetLife annual report below. You can navigate through the pages in the report by either clicking on the pages listed below, or by using the keyword search tool below to find specific information within the annual report.-
 1
1 -
2
-
3
-
4
-
5
-
6
-
7
-
8
-
9
-
10
-
11
-
12
-
13
-
14
-
15
-
16
-
17
-
18
-
19
-
20
-
21
-
22
-
23
-
24
-
25
-
26
-
27
-
28
-
29
-
30
-
31
-
32
-
33
-
34
-
35
-
36
-
37
-
38
-
39
-
40
-
41
-
42
-
43
-
44
-
45
-
46
-
47
-
48
-
49
-
50
-
51
-
52
-
53
-
54
-
55
-
56
-
57
-
58
-
59
-
60
-
61
-
62
-
63
-
64
-
65
-
66
-
67
-
68
-
69
-
70
-
71
-
72
-
73
-
74
-
75
-
76
-
77
-
78
-
79
-
80
-
81
-
82
-
83
-
84
-
85
-
86
-
87
-
88
-
89
-
90
-
91
-
92
-
93
-
94
-
95
-
96
-
97
-
98
-
99
-
100
-
101
-
102
-
103
-
104
-
105
-
106
-
107
-
108
-
109
-
110
-
111
-
112
-
113
-
114
-
115
-
116
-
117
-
118
-
119
-
120
-
121
-
122
-
123
-
124
-
125
-
126
-
127
-
128
-
129
-
130
-
131
-
132
-
133
-
134
-
135
-
136
-
137
-
138
-
139
-
140
-
141
-
142
-
143
-
144
-
145
-
146
-
147
-
148
-
149
-
150
-
151
-
152
-
153
-
154
-
155
-
156
-
157
-
158
-
159
-
160
-
161
-
162
-
163
-
164
-
165
-
166
-
167
-
168
-
169
-
170
-
171
-
172
-
173
-
174
-
175
-
176
-
177
-
178
-
179
-
180
-
181
-
182
-
183
-
184
-
185
-
186
-
187
-
 188
188 -
 189
189 -
 190
190 -
 191
191 -
 192
192 -
 193
193 -
 194
194 -
 195
195 -
 196
196 -
 197
197 -
 198
198 -
 199
199 -
 200
200 -
 201
201 -
 202
202 -
 203
203 -
 204
204 -
 205
205 -
 206
206 -
 207
207 -
 208
208 -
209
-
210
-
211
-
212
-
213
-
214
-
215
 |
 |

MetLife, Inc.
Notes to the Consolidated Financial Statements — (Continued)
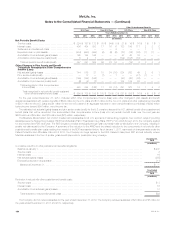
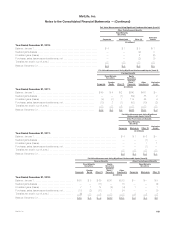
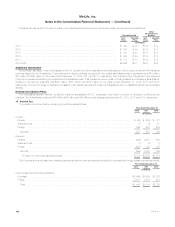
Gross benefit payments for the next 10 years, which reflect expected future service where appropriate, are expected to be as follows:
Pension Benefits
Other
Postretirement
Benefits
U.S.
Plans Non-U.S.
Plans U.S.
Plans Non-U.S.
Plans
(In millions)
2013 ............................................................................... $ 436 $ 42 $112 $ 4
2014 ............................................................................... $ 473 $ 44 $115 $ 3
2015 ............................................................................... $ 470 $ 48 $117 $ 3
2016 ............................................................................... $ 489 $ 54 $119 $ 3
2017 ............................................................................... $ 517 $ 57 $119 $ 3
2018-2022 .......................................................................... $2,866 $311 $613 $15
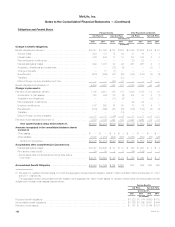
Additional Information
As previously discussed, most of the assets of the U.S. pension and other postretirement benefit plans are held in group annuity and life insurance
contracts issued by the Subsidiaries. Total revenues from these contracts recognized in the consolidated statements of operations were $54 million,
$47 million and $46 million for the years ended December 31, 2012, 2011 and 2010, respectively, and included policy charges and net investment
income from investments backing the contracts and administrative fees. Total investment income (loss), including realized and unrealized gains (losses),
credited to the account balances was $867 million, $885 million and $767 million for the years ended December 31, 2012, 2011 and 2010,
respectively. The terms of these contracts are consistent in all material respects with those the Subsidiaries offer to unaffiliated parties that are similarly
situated.
Defined Contribution Plans
The Subsidiaries sponsor defined contribution plans for substantially all U.S. employees under which a portion of employee contributions are
matched. The Subsidiaries contributed $96 million, $95 million and $86 million for the years ended December 31, 2012, 2011 and 2010, respectively.
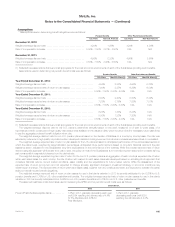
19. Income Tax
The provision for income tax from continuing operations was as follows:
Years Ended December 31,
2012 2011 2010
(In millions)
Current:
Federal ........................................................................................ $ (29) $ (200) $ 121
State and local .................................................................................. 6 (1) 21
Foreign ........................................................................................ 846 614 203
Subtotal ...................................................................................... 823 413 345
Deferred:
Federal ........................................................................................ (244) 2,241 643
State and local .................................................................................. (1) (3) (7)
Foreign ........................................................................................ (450) 142 129
Subtotal ...................................................................................... (695) 2,380 765
Provision for income tax expense (benefit) ......................................................... $128 $2,793 $1,110
The Company’s income (loss) from continuing operations before income tax expense (benefit) from domestic and foreign operations were as follows:
Years Ended December 31,
2012 2011 2010
(In millions)
Income (loss) from continuing operations:
Domestic ..................................................................................... $(1,496) $6,869 $3,126
Foreign ....................................................................................... 2,938 2,315 603
Total ....................................................................................... $1,442 $9,184 $3,729
192 MetLife, Inc.