MetLife 2012 Annual Report Download - page 60
Download and view the complete annual report
Please find page 60 of the 2012 MetLife annual report below. You can navigate through the pages in the report by either clicking on the pages listed below, or by using the keyword search tool below to find specific information within the annual report.-
 1
1 -
2
-
3
-
4
-
5
-
6
-
7
-
8
-
9
-
10
-
11
-
12
-
13
-
14
-
15
-
16
-
17
-
18
-
19
-
20
-
21
-
22
-
23
-
24
-
25
-
26
-
27
-
28
-
29
-
30
-
31
-
32
-
33
-
34
-
35
-
36
-
37
-
38
-
39
-
40
-
41
-
42
-
43
-
44
-
45
-
46
-
47
-
48
-
49
-
 50
50 -
 51
51 -
 52
52 -
 53
53 -
 54
54 -
 55
55 -
 56
56 -
 57
57 -
 58
58 -
 59
59 -
 60
60 -
 61
61 -
 62
62 -
 63
63 -
 64
64 -
 65
65 -
 66
66 -
 67
67 -
 68
68 -
 69
69 -
 70
70 -
71
-
72
-
73
-
74
-
75
-
76
-
77
-
78
-
79
-
80
-
81
-
82
-
83
-
84
-
85
-
86
-
87
-
88
-
89
-
90
-
91
-
92
-
93
-
94
-
95
-
96
-
97
-
98
-
99
-
100
-
101
-
102
-
103
-
104
-
105
-
106
-
107
-
108
-
109
-
110
-
111
-
112
-
113
-
114
-
115
-
116
-
117
-
118
-
119
-
120
-
121
-
122
-
123
-
124
-
125
-
126
-
127
-
128
-
129
-
130
-
131
-
132
-
133
-
134
-
135
-
136
-
137
-
138
-
139
-
140
-
141
-
142
-
143
-
144
-
145
-
146
-
147
-
148
-
149
-
150
-
151
-
152
-
153
-
154
-
155
-
156
-
157
-
158
-
159
-
160
-
161
-
162
-
163
-
164
-
165
-
166
-
167
-
168
-
169
-
170
-
171
-
172
-
173
-
174
-
175
-
176
-
177
-
178
-
179
-
180
-
181
-
182
-
183
-
184
-
185
-
186
-
187
-
188
-
189
-
190
-
191
-
192
-
193
-
194
-
195
-
196
-
197
-
198
-
199
-
200
-
201
-
202
-
203
-
204
-
205
-
206
-
207
-
208
-
209
-
210
-
211
-
212
-
213
-
214
-
215
 |
 |

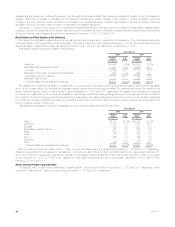
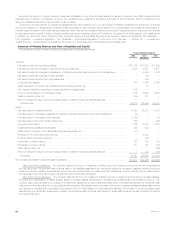
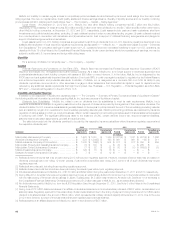
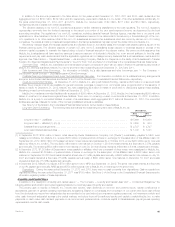
Derivatives Hedging Variable Annuity Guarantees
In addition to reinsurance and our risk mitigating steps described above, we have a hedging strategy that uses various over the counter and
exchanged traded derivatives. The table below presents the estimated fair value of the derivatives hedging our variable annuity guarantees:
December 31,
2012 2011
Primary Underlying
Risk Exposure
Notional Estimated Fair Value Notional Estimated Fair Value
Instrument Type Amount Assets Liabilities Amount Assets Liabilities
(In millions)
Interest rate Interest rate swaps ..................... $24,041 $1,973 $ 614 $22,719 $1,869 $598
Interest rate futures ..................... 8,913 1 25 11,126 17 16
Interest rate options .................... 11,440 303 58 11,372 567 6
Foreign currency exchange rate Foreign currency forwards ............... 2,281 1 177 2,311 41 4
Foreign currency futures ................. 518 4 — 178 — —
Equity market Equity futures ......................... 6,993 14 132 6,942 22 10
Equity options ......................... 21,759 2,824 356 16,756 3,260 177
Variance swaps ....................... 19,830 122 310 18,801 397 75
Total rate of return swaps ................ 3,092 5 103 1,644 10 34
Total .............................. $98,867 $5,247 $1,775 $91,849 $6,183 $920
The change in estimated fair values of our derivatives is recorded in policyholder benefits and claims if they are hedging guarantees included in future
policy benefits, and in net derivative gains (losses) if they are hedging guarantees included in PABs.
Our hedging strategy involves the significant use of static longer-term derivative instruments to avoid the need to execute transactions during periods
of market disruption or higher volatility. We continually monitor the capital markets for opportunities to adjust our liability coverage, as appropriate. Futures
are also used to dynamically adjust the daily coverage levels as markets and liability exposures fluctuate.
We remain liable for the guaranteed benefits in the event that reinsurers or derivative counterparties are unable or unwilling to pay. Certain of our
reinsurance agreements and most derivative positions are collateralized and derivatives positions are subject to master netting agreements, both of
which significantly reduce the exposure to counterparty risk. In addition, we are subject to the risk that hedging and other risk management actions
prove ineffective or that unanticipated policyholder behavior or mortality, combined with adverse market events, produces economic losses beyond the
scope of the risk management techniques employed.
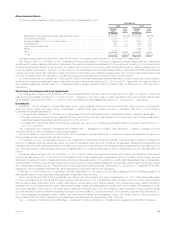
Liquidity and Capital Resources
Overview
Our business and results of operations are materially affected by conditions in the global capital markets and the economy generally. Stressed
conditions, volatility and disruptions in global capital markets, particular markets, or financial asset classes can have an adverse effect on us, in part
because we have a large investment portfolio and our insurance liabilities are sensitive to changing market factors. The global markets and economy
continue to experience significant volatility that may affect our financing costs and market interest for our debt or equity securities. For further information
regarding market factors that could affect our ability to meet liquidity and capital needs, see “— Industry Trends” and “— Investments — Current
Environment.”
Liquidity Management
Based upon the strength of our franchise, diversification of our businesses, strong financial fundamentals and the substantial funding sources
available to us as described herein, we continue to believe we have access to ample liquidity to meet business requirements under current market
conditions and unlikely but reasonably possible stress scenarios.
Short-term Liquidity. We maintain a substantial short-term liquidity position, which was $24.1 billion and $16.2 billion at December 31, 2012
and 2011, respectively. Short-term liquidity includes cash and cash equivalents and short-term investments, excluding: (i) cash collateral received
under our securities lending program, and (ii) cash collateral received from counterparties in connection with derivatives. We continuously monitor
and adjust our liquidity and capital plans for MetLife, Inc. and its subsidiaries in light of changing needs and opportunities.
Liquid Assets. An integral part of our liquidity management includes managing our level of liquid assets, which was $292.2 billion and $258.9
billion at December 31, 2012 and 2011, respectively. Liquid assets include cash and cash equivalents, short-term investments and publicly-traded
securities, excluding: (i) cash collateral received under our securities lending program that has been reinvested; (ii) cash collateral received from
counterparties in connection with derivatives; (iii) cash and cash equivalents, short-term investments and securities on deposit with regulatory
agencies; and (iv) securities held in trust in support of collateral financing arrangements and pledged in support of debt and funding agreements,
derivatives and short sale agreements.
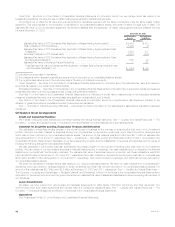
Capital Management
We have established several senior management committees as part of our capital management process. These committees, including the Capital
Management Committee and the Enterprise Risk Committee, regularly review actual and projected capital levels (under a variety of scenarios including
stress scenarios) and our capital plan in accordance with our capital policy. The Capital Management Committee is comprised of members of senior
management, including MetLife, Inc.’s Chief Financial Officer, Treasurer and Chief Risk Officer. The Enterprise Risk Committee is also comprised of
members of senior management, including MetLife, Inc.’s Chief Financial Officer, Chief Risk Officer and Chief Investment Officer.
Our Board and senior management are directly involved in the development and maintenance of our capital policy. The capital policy sets forth,
among other things, minimum and target capital levels and the governance of the capital management process. All capital actions, including proposed
changes to the capital plan, capital targets or capital policy, are reviewed by the Finance and Risk Committee of the Board prior to obtaining full Board
approval. The Board approves the capital policy and the annual capital plan and authorizes capital actions, as required.
54 MetLife, Inc.