MetLife 2012 Annual Report Download - page 27
Download and view the complete annual report
Please find page 27 of the 2012 MetLife annual report below. You can navigate through the pages in the report by either clicking on the pages listed below, or by using the keyword search tool below to find specific information within the annual report.-
 1
1 -
2
-
3
-
4
-
5
-
6
-
7
-
8
-
9
-
10
-
11
-
12
-
13
-
14
-
15
-
16
-
 17
17 -
 18
18 -
 19
19 -
 20
20 -
 21
21 -
 22
22 -
 23
23 -
 24
24 -
 25
25 -
 26
26 -
 27
27 -
 28
28 -
 29
29 -
 30
30 -
 31
31 -
 32
32 -
 33
33 -
 34
34 -
 35
35 -
 36
36 -
 37
37 -
38
-
39
-
40
-
41
-
42
-
43
-
44
-
45
-
46
-
47
-
48
-
49
-
50
-
51
-
52
-
53
-
54
-
55
-
56
-
57
-
58
-
59
-
60
-
61
-
62
-
63
-
64
-
65
-
66
-
67
-
68
-
69
-
70
-
71
-
72
-
73
-
74
-
75
-
76
-
77
-
78
-
79
-
80
-
81
-
82
-
83
-
84
-
85
-
86
-
87
-
88
-
89
-
90
-
91
-
92
-
93
-
94
-
95
-
96
-
97
-
98
-
99
-
100
-
101
-
102
-
103
-
104
-
105
-
106
-
107
-
108
-
109
-
110
-
111
-
112
-
113
-
114
-
115
-
116
-
117
-
118
-
119
-
120
-
121
-
122
-
123
-
124
-
125
-
126
-
127
-
128
-
129
-
130
-
131
-
132
-
133
-
134
-
135
-
136
-
137
-
138
-
139
-
140
-
141
-
142
-
143
-
144
-
145
-
146
-
147
-
148
-
149
-
150
-
151
-
152
-
153
-
154
-
155
-
156
-
157
-
158
-
159
-
160
-
161
-
162
-
163
-
164
-
165
-
166
-
167
-
168
-
169
-
170
-
171
-
172
-
173
-
174
-
175
-
176
-
177
-
178
-
179
-
180
-
181
-
182
-
183
-
184
-
185
-
186
-
187
-
188
-
189
-
190
-
191
-
192
-
193
-
194
-
195
-
196
-
197
-
198
-
199
-
200
-
201
-
202
-
203
-
204
-
205
-
206
-
207
-
208
-
209
-
210
-
211
-
212
-
213
-
214
-
215
 |
 |

The favorable change in net derivative gains (losses) on VA program derivatives was $2.2 billion ($1.4 billion, net of income tax). This was due to an
favorable change of $1.9 billion ($1.2 billion, net of income tax) related to the change in the nonperformance risk adjustment on embedded derivatives
and a favorable change of $277 million ($180 million, net of income tax) on market and other risks in embedded derivatives, net of the impact of
freestanding derivatives hedging those risks.
The favorable change of $277 million is comprised of a $3.2 billion ($2.1 billion, net of income tax) favorable change in freestanding derivatives that hedge
market risks in embedded derivatives, partially offset by a $2.9 billion ($1.9 billion, net of income tax) unfavorable change in market and other risksinour
embedded derivatives, which was primarily driven by changes in market factors. The primary changes in market factors are summarized as follows:
‰Key equity index levels decreased in the current period but were mixed in the prior period, and equity volatility was mixed in both the current
period and prior period. These changes contributed to a favorable change in our freestanding derivatives and an unfavorable change in our
embedded derivatives.
‰Long-term and mid-term interest rates decreased more in the current period than in the prior period and contributed to a favorable change in our
freestanding derivatives and unfavorable changes in our embedded derivatives.
‰Changes in foreign currency exchange rates contributed to an unfavorable change in our freestanding derivatives and a favorable change in our
embedded derivatives.
The increase in net investment losses primarily reflects impairments on Greece sovereign debt securities, intent-to-sell OTTI on other sovereign debt
securities due to the repositioning of the ALICO portfolio into longer duration and higher yielding investments, intent-to-sell OTTI related to the Divested
Businesses, and lower net gains on sales of fixed maturity and equity securities. These losses were partially offset by net gains on the sales of certain
real estate investments and reductions in the mortgage valuation allowance reflecting improving real estate market fundamentals.
Income (loss) from continuing operations, before provision for income tax, related to Divested Businesses, excluding net investment gains (losses)
and net derivative gains (losses), decreased $318 million to income of $65 million in 2011 compared to income of $383 million in 2010. Included in this
loss was an increase in total revenues of $28 million and an increase in total expenses of $346 million.
Income tax expense for the year ended December 31, 2011 was $2.8 billion, or 30% of income (loss) from continuing operations before provision
for income tax, compared with $1.1 billion, or 30% of income (loss) from continuing operations before provision for income tax, for 2010. The
Company’s 2011 and 2010 effective tax rates differ from the U.S. statutory rate of 35% primarily due to the impact of certain permanent tax differences,
including non-taxable investment income and tax credits for investments in low income housing, in relation to income (loss) from continuing operations
before provision for income tax, as well as certain foreign permanent tax differences.
Operating earnings available to common shareholders increased $1.1 billion, net of income tax, to $4.7 billion, net of income tax, in 2011 from $3.6
billion, net of income tax, in 2010.
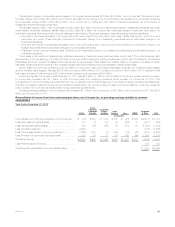
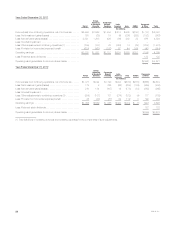
Reconciliation of income (loss) from continuing operations, net of income tax, to operating earnings available to common
shareholders
Year Ended December 31, 2012
Retail
Group,
Voluntary
& Worksite
Benefits
Corporate
Benefit
Funding Latin
America Asia EMEA Corporate
& Other Total
(In millions)
Income (loss) from continuing operations, net of income tax . . $ (44) $ 824 $ 1,204 $ 479 $ 976 $ 293 $(2,418) $ 1,314
Less: Net investment gains (losses) ..................... 212 (7) 107 (2) (342) 31 (351) (352)
Less: Net derivative gains (losses) ...................... 162 (63) (157) 38 (170) 61 (1,790) (1,919)
Less: Goodwill impairment ............................ (1,692) – – – – – (176) (1,868)
Less:Otheradjustmentstocontinuingoperations(1) ........ (1,260) (141) 19 (193) (32) (22) (921) (2,550)
Less: Provision for income tax (expense) benefit ........... 532 75 11 53 483 (48) 1,089 2,195
Operating earnings .................................. $2,002 $ 960 $ 1,224 $ 583 $ 1,037 $ 271 (269) 5,808
Less: Preferred stock dividends ........................ 122 122
Operating earnings available to common shareholders ...... $ (391) $ 5,686
MetLife, Inc. 21