MetLife 2012 Annual Report Download - page 46
Download and view the complete annual report
Please find page 46 of the 2012 MetLife annual report below. You can navigate through the pages in the report by either clicking on the pages listed below, or by using the keyword search tool below to find specific information within the annual report.-
 1
1 -
2
-
3
-
4
-
5
-
6
-
7
-
8
-
9
-
10
-
11
-
12
-
13
-
14
-
15
-
16
-
17
-
18
-
19
-
20
-
21
-
22
-
23
-
24
-
25
-
26
-
27
-
28
-
29
-
30
-
31
-
32
-
33
-
34
-
35
-
 36
36 -
 37
37 -
 38
38 -
 39
39 -
 40
40 -
 41
41 -
 42
42 -
 43
43 -
 44
44 -
 45
45 -
 46
46 -
 47
47 -
 48
48 -
 49
49 -
 50
50 -
 51
51 -
 52
52 -
 53
53 -
 54
54 -
 55
55 -
 56
56 -
57
-
58
-
59
-
60
-
61
-
62
-
63
-
64
-
65
-
66
-
67
-
68
-
69
-
70
-
71
-
72
-
73
-
74
-
75
-
76
-
77
-
78
-
79
-
80
-
81
-
82
-
83
-
84
-
85
-
86
-
87
-
88
-
89
-
90
-
91
-
92
-
93
-
94
-
95
-
96
-
97
-
98
-
99
-
100
-
101
-
102
-
103
-
104
-
105
-
106
-
107
-
108
-
109
-
110
-
111
-
112
-
113
-
114
-
115
-
116
-
117
-
118
-
119
-
120
-
121
-
122
-
123
-
124
-
125
-
126
-
127
-
128
-
129
-
130
-
131
-
132
-
133
-
134
-
135
-
136
-
137
-
138
-
139
-
140
-
141
-
142
-
143
-
144
-
145
-
146
-
147
-
148
-
149
-
150
-
151
-
152
-
153
-
154
-
155
-
156
-
157
-
158
-
159
-
160
-
161
-
162
-
163
-
164
-
165
-
166
-
167
-
168
-
169
-
170
-
171
-
172
-
173
-
174
-
175
-
176
-
177
-
178
-
179
-
180
-
181
-
182
-
183
-
184
-
185
-
186
-
187
-
188
-
189
-
190
-
191
-
192
-
193
-
194
-
195
-
196
-
197
-
198
-
199
-
200
-
201
-
202
-
203
-
204
-
205
-
206
-
207
-
208
-
209
-
210
-
211
-
212
-
213
-
214
-
215
 |
 |

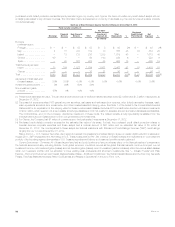
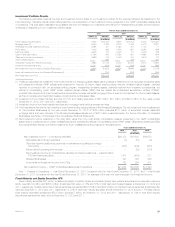
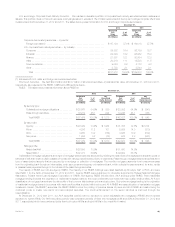
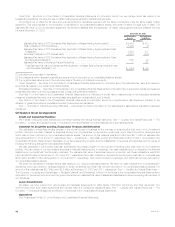
The following table presents total fixed maturity securities by NRSRO designation and the equivalent designations of the NAIC, except for certain
structured securities, which are presented as described above, as well as the percentage, based on estimated fair value that each designation is
comprised of at:
December 31,
2012 2011
NAIC
Rating Rating Agency Designation Amortized
Cost Unrealized
Gain (Loss)
Estimated
Fair
Value %of
Total Amortized
Cost Unrealized
Gain (Loss)
Estimated
Fair
Value %of
Total
(In millions) (In millions)
1 Aaa/Aa/A .................................... $234,371 $ 24,197 $ 258,568 69.1% $ 230,195 $ 16,591 $ 246,786 70.5%
2 Baa ........................................ 81,530 8,663 90,193 24.1 73,352 5,179 78,531 22.4
Subtotal investment grade ..................... 315,901 32,860 348,761 93.2 303,547 21,770 325,317 92.9
3 Ba ......................................... 13,882 552 14,434 3.8 14,604 (229) 14,375 4.1
4 B .......................................... 9,470 137 9,607 2.6 9,437 (588) 8,849 2.5
5 Caa and lower ................................ 1,543 (164) 1,379 0.4 2,142 (474) 1,668 0.5
6 In or near default .............................. 74 11 85 — 81 (19) 62 —
Subtotal below investment grade ................ 24,969 536 25,505 6.8 26,264 (1,310) 24,954 7.1
Total fixed maturity securities ................. $340,870 $ 33,396 $ 374,266 100.0% $ 329,811 $ 20,460 $ 350,271 100.0%
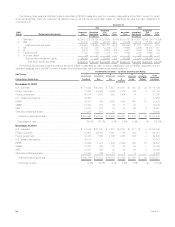
The following tables present total fixed maturity securities, based on estimated fair value, by sector classification and by NRSRO designation and the
equivalent designations of the NAIC, except for certain structured securities, which are presented as described above:
Fixed Maturity Securities — by Sector & Credit Quality Rating
NAIC Rating: 1 2 3 4 5 6 Total
Estimated
Fair ValueRating Agency Designation: Aaa/Aa/A Baa Ba B Caa and
Lower In or Near
Default
(In millions)
December 31, 2012:
U.S. corporate ......................................... $ 51,648 $ 48,622 $ 8,597 $ 4,831 $ 380 $ 48 $ 114,126
Foreign corporate ....................................... 31,937 30,509 3,249 1,418 66 5 67,184
Foreign government ..................................... 46,314 8,501 933 1,504 84 — 57,336
U.S. Treasury and agency ................................ 47,967 — — — — — 47,967
RMBS ............................................... 32,377 894 1,582 1,809 790 27 37,479
CMBS ............................................... 18,843 193 43 11 39 — 19,129
ABS ................................................. 15,247 673 18 34 20 5 15,997
State and political subdivision ............................. 14,235 801 12 — — — 15,048
Total fixed maturity securities ............................ $258,568 $ 90,193 $ 14,434 $ 9,607 $ 1,379 $ 85 $ 374,266
Percentage of total .................................... 69.1% 24.1% 3.8% 2.6% 0.4% —% 100.0%
December 31, 2011:
U.S. corporate ......................................... $ 51,045 $ 41,533 $ 8,677 $ 4,257 $ 271 $ 2 $ 105,785
Foreign corporate ....................................... 33,403 26,383 2,915 1,173 140 4 64,018
Foreign government ..................................... 42,360 7,553 1,146 1,281 196 — 52,536
U.S. Treasury and agency ................................ 40,012 — — — — — 40,012
RMBS ............................................... 36,699 1,477 1,450 2,026 933 52 42,637
CMBS ............................................... 18,403 388 125 57 96 — 19,069
ABS ................................................. 12,507 355 39 50 24 4 12,979
State and political subdivision ............................. 12,357 842 23 5 8 — 13,235
Total fixed maturity securities ............................ $246,786 $ 78,531 $ 14,375 $ 8,849 $ 1,668 $ 62 $ 350,271
Percentage of total .................................... 70.5% 22.4% 4.1% 2.5% 0.5% —% 100.0%
40 MetLife, Inc.