MetLife 2012 Annual Report Download - page 165
Download and view the complete annual report
Please find page 165 of the 2012 MetLife annual report below. You can navigate through the pages in the report by either clicking on the pages listed below, or by using the keyword search tool below to find specific information within the annual report.-
 1
1 -
2
-
3
-
4
-
5
-
6
-
7
-
8
-
9
-
10
-
11
-
12
-
13
-
14
-
15
-
16
-
17
-
18
-
19
-
20
-
21
-
22
-
23
-
24
-
25
-
26
-
27
-
28
-
29
-
30
-
31
-
32
-
33
-
34
-
35
-
36
-
37
-
38
-
39
-
40
-
41
-
42
-
43
-
44
-
45
-
46
-
47
-
48
-
49
-
50
-
51
-
52
-
53
-
54
-
55
-
56
-
57
-
58
-
59
-
60
-
61
-
62
-
63
-
64
-
65
-
66
-
67
-
68
-
69
-
70
-
71
-
72
-
73
-
74
-
75
-
76
-
77
-
78
-
79
-
80
-
81
-
82
-
83
-
84
-
85
-
86
-
87
-
88
-
89
-
90
-
91
-
92
-
93
-
94
-
95
-
96
-
97
-
98
-
99
-
100
-
101
-
102
-
103
-
104
-
105
-
106
-
107
-
108
-
109
-
110
-
111
-
112
-
113
-
114
-
115
-
116
-
117
-
118
-
119
-
120
-
121
-
122
-
123
-
124
-
125
-
126
-
127
-
128
-
129
-
130
-
131
-
132
-
133
-
134
-
135
-
136
-
137
-
138
-
139
-
140
-
141
-
142
-
143
-
144
-
145
-
146
-
147
-
148
-
149
-
150
-
151
-
152
-
153
-
154
-
 155
155 -
 156
156 -
 157
157 -
 158
158 -
 159
159 -
 160
160 -
 161
161 -
 162
162 -
 163
163 -
 164
164 -
 165
165 -
 166
166 -
 167
167 -
 168
168 -
 169
169 -
 170
170 -
 171
171 -
 172
172 -
 173
173 -
 174
174 -
 175
175 -
176
-
177
-
178
-
179
-
180
-
181
-
182
-
183
-
184
-
185
-
186
-
187
-
188
-
189
-
190
-
191
-
192
-
193
-
194
-
195
-
196
-
197
-
198
-
199
-
200
-
201
-
202
-
203
-
204
-
205
-
206
-
207
-
208
-
209
-
210
-
211
-
212
-
213
-
214
-
215
 |
 |

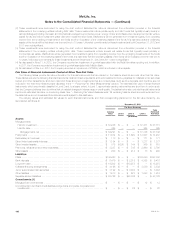
MetLife, Inc.
Notes to the Consolidated Financial Statements — (Continued)
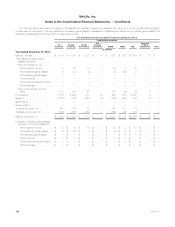
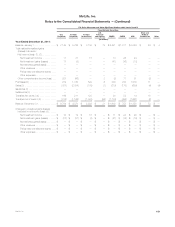
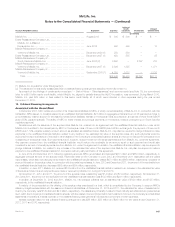
Residential Mortgage
Loans Held-for-Sale (1)
Securitized Reverse
Residential Mortgage
Loans (2)
Assets and
Liabilities Held by
CSEs (3)
December 31, December 31, December 31,
2012 2011 2012 2011 2012 2011
Assets: (In millions)
Unpaid principal balance .................................................... $80 $2,935 $— $6,914 $2,539 $3,019
Difference between estimated fair value and unpaid principal balance ................. (31) 129 — 738 127 119
Carrying value at estimated fair value ......................................... $49 $3,064 $— $7,652 $2,666 $3,138
Loans in non-accrual status .................................................. $ 3 $ 3 $— $ — $ — $ —
Loans more than 90 days past due ............................................ $23 $ 20 $— $ 59 $ — $ —
Loans in non-accrual status or more than 90 days past due, or both — difference between
aggregate estimated fair value and unpaid principal balance ....................... $(14) $ (2) $— $ — $ — $ —
Liabilities:
Contractual principal balance ................................................. $— $6,914 $2,430 $2,954
Difference between estimated fair value and contractual principal balance .............. — 712 97 114
Carrying value at estimated fair value ......................................... $— $7,626 $2,527 $3,068
(1) Interest income on residential mortgage loans held-for-sale is recorded based on the stated rate of the loan and is recorded in net investment
income. Gains and losses from initial measurement, subsequent changes in estimated fair value and gains or losses on sales are recognized in
other revenues. Such changes in estimated fair value for these loans were due to the following: Years Ended
December 31,
2012 2011 2010
(In millions)
Instrument-specific credit risk based on changes in credit spreads for non-agency loans and adjustments in individual loan
quality ............................................................................................. $(1) $ (3) $ (1)
Other changes in estimated fair value ....................................................................... 68 511 487
Total gains (losses) recognized in other revenues ............................................................ $67 $508 $486
(2) Gains and losses from initial measurement and subsequent changes in estimated fair value are recognized in other revenues for securitized reverse
residential mortgage loans and related liabilities.
(3) Assets and liabilities held by CSEs are comprised of the commercial mortgage loans and long-term debt held by CSEs. Gains and losses from initial
measurement, subsequent changes in estimated fair value and gains or losses on sales of these assets and liabilities are recognized in net
investment gains (losses). Interest income on commercial mortgage loans held by CSEs is recognized in net investment income. Interest expense
from long-term debt of CSEs is recognized in other expenses.
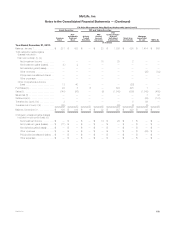
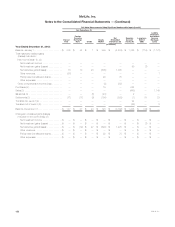
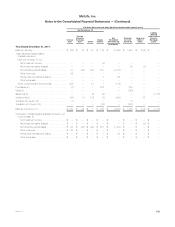
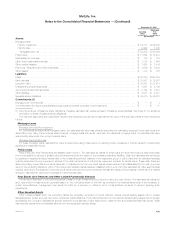
Nonrecurring Fair Value Measurements
The following table presents information for assets measured at estimated fair value on a nonrecurring basis during the periods presented; that is,
they are not measured at fair value on a recurring basis but are subject to fair value adjustments only in certain circumstances (for example, when there
is evidence of impairment). The estimated fair values for these assets were determined using significant unobservable inputs (Level 3).
Years Ended December 31,
2012 2011 2010
Carrying
Value Prior to
Measurement
Carrying
Value
After
Measurement Gains
(Losses)
Carrying
Value Prior to
Measurement
Carrying
Value
After
Measurement Gains
(Losses)
Carrying
Value Prior to
Measurement
Carrying
Value
After
Measurement Gains
(Losses)
(In millions)
Mortgage loans: (1) ...................
Held-for-investment ................. $ 439 $428 $ (11) $166 $151 $(15) $179 $164 $(15)
Held-for-sale ....................... $ 350 $319 $ (31) $ 61 $ 58 $ (3) $ 35 $ 33 $ (2)
Other limited partnership interests (2) ...... $ 87 $ 54 $ (33) $ 18 $ 13 $ (5) $ 35 $ 23 $(12)
Real estate joint ventures (3) ............. $ 16 $ 10 $ (6) $ — $ — $— $ 33 $ 8 $(25)
Goodwill (4) ......................... $1,868 $ — $(1,868) $ 65 $ — $(65) $ — $ — $ —
Other assets (5) ...................... $ 109 $ 32 $ (77) $ — $ — $ — $ — $ — $ —
(1) The carrying value after measurement has been adjusted for the excess of the carrying value prior to measurement over the estimated fair value.
Estimated fair values for impaired mortgage loans are based on independent broker quotations or valuation models using unobservable inputs or, if
the loans are in foreclosure or are otherwise determined to be collateral dependent, are based on the estimated fair value of the underlying collateral
or the present value of the expected future cash flows.
MetLife, Inc. 159