MetLife 2012 Annual Report Download - page 13
Download and view the complete annual report
Please find page 13 of the 2012 MetLife annual report below. You can navigate through the pages in the report by either clicking on the pages listed below, or by using the keyword search tool below to find specific information within the annual report.-
 1
1 -
2
-
 3
3 -
 4
4 -
 5
5 -
 6
6 -
 7
7 -
 8
8 -
 9
9 -
 10
10 -
 11
11 -
 12
12 -
 13
13 -
 14
14 -
 15
15 -
 16
16 -
 17
17 -
 18
18 -
 19
19 -
 20
20 -
 21
21 -
 22
22 -
 23
23 -
24
-
25
-
26
-
27
-
28
-
29
-
30
-
31
-
32
-
33
-
34
-
35
-
36
-
37
-
38
-
39
-
40
-
41
-
42
-
43
-
44
-
45
-
46
-
47
-
48
-
49
-
50
-
51
-
52
-
53
-
54
-
55
-
56
-
57
-
58
-
59
-
60
-
61
-
62
-
63
-
64
-
65
-
66
-
67
-
68
-
69
-
70
-
71
-
72
-
73
-
74
-
75
-
76
-
77
-
78
-
79
-
80
-
81
-
82
-
83
-
84
-
85
-
86
-
87
-
88
-
89
-
90
-
91
-
92
-
93
-
94
-
95
-
96
-
97
-
98
-
99
-
100
-
101
-
102
-
103
-
104
-
105
-
106
-
107
-
108
-
109
-
110
-
111
-
112
-
113
-
114
-
115
-
116
-
117
-
118
-
119
-
120
-
121
-
122
-
123
-
124
-
125
-
126
-
127
-
128
-
129
-
130
-
131
-
132
-
133
-
134
-
135
-
136
-
137
-
138
-
139
-
140
-
141
-
142
-
143
-
144
-
145
-
146
-
147
-
148
-
149
-
150
-
151
-
152
-
153
-
154
-
155
-
156
-
157
-
158
-
159
-
160
-
161
-
162
-
163
-
164
-
165
-
166
-
167
-
168
-
169
-
170
-
171
-
172
-
173
-
174
-
175
-
176
-
177
-
178
-
179
-
180
-
181
-
182
-
183
-
184
-
185
-
186
-
187
-
188
-
189
-
190
-
191
-
192
-
193
-
194
-
195
-
196
-
197
-
198
-
199
-
200
-
201
-
202
-
203
-
204
-
205
-
206
-
207
-
208
-
209
-
210
-
211
-
212
-
213
-
214
-
215
 |
 |
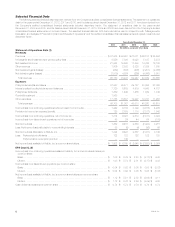
nonperformance risk adjustment. In addition, the current year includes a $1.9 billion ($1.6 billion, net of income tax) non-cash charge for goodwill
impairment associated with our U.S. retail annuities business. The current year also includes a $1.2 billion ($752 million, net of income tax) charge
associated with the global review of assumptions related to DAC, reserves and certain intangibles, of which $526 million ($342 million, net of income
tax) was reflected in net derivative gains (losses). Also included in income (loss) from continuing operations, net of income tax, were the unfavorable
results of the discontinued operations and other businesses that have been or will be sold or exited by MetLife, Inc. (“Divested Businesses”), which
decreased $724 million ($476 million, net of income tax) from the prior year. These declines were partially offset by a $1.0 billion, net of income tax,
increase in operating earnings available to common shareholders.
The increase in operating earnings available to common shareholders was primarily driven by improved investment results and higher asset-based
fee revenue as strong sales levels drove portfolio growth. In addition, the low interest rate environment resulted in lower average interest credited rates.
Despite the impact of Superstorm Sandy, catastrophe losses were lower in 2012 as compared to the significant weather-related claims in 2011. In
addition, the prior year included a $117 million, net of income tax, charge in connection with the Company’s use of the U.S. Social Security
Administration’s Death Master File. The prior year also included $40 million, net of income tax, of expenses incurred related to a liquidation plan filed by
the New York State Department of Financial Services (the “Department of Financial Services”) for Executive Life Insurance Company of New York
(“ELNY”). Current year results include a $52 million, net of income tax, charge representing a multi-state examination payment related to unclaimed
property and MetLife’s use of the U.S. Social Security Administration’s Death Master File to identify potential life insurance claims, as well as the
expected acceleration of benefit payments to policyholders under the settlements. The current year also includes a $50 million, net of income tax,
impairment charge on an intangible asset related to a previously acquired dental business.
Year Ended December 31, 2011 Compared with the Year Ended December 31, 2010
During the year ended December 31, 2011, income (loss) from continuing operations, net of income tax, increased $3.8 billion over 2010. The
change was predominantly due to a $5.1 billion ($3.3 billion, net of income tax) favorable change in net derivative gains (losses) primarily due to the
impact of falling long-term and mid-term interest rates and equity market movements and volatility. In addition, a $1.1 billion, net of income tax, favorable
change in operating earnings available to common shareholders, which includes the impact of the ALICO Acquisition, also contributed to the increase.
The ALICO Acquisition drove the majority of the $1.1 billion increase in operating earnings available to common shareholders. In addition, improved
investment performance was driven by portfolio growth resulting from increased sales across many of our businesses, which more than offset the
negative impact of the declining interest rate environment on yields. Current year results were negatively impacted by severe weather, as well as, in the
third quarter of 2011, a charge to increase reserves in connection with the Company’s use of the U.S. Social Security Administration’s Death Master File
and similar databases to identify potential life insurance claims that have not been presented to the Company and expenses incurred related to a
liquidation plan filed by the Department of Financial Services for ELNY.
Consolidated Company Outlook
In 2013, despite pressure from low interest rates, we expect operating earnings to be in line with 2012, driven primarily by the following:
‰Growth in premiums, fees and other revenues driven by:
– Rational pricing strategy in the group insurance marketplace;
– Increases in our businesses outside of the U.S., notably accident & health, from continuing organic growth throughout our various geographic
regions and leveraging of our multichannel distribution network.
‰Expanding our presence in emerging markets, including potential merger and acquisition activity.
‰Focus on disciplined underwriting. We see no significant changes to the underlying trends that drive underwriting results; however, unanticipated
catastrophes, similar to Superstorm Sandy could result in a high volume of claims.
‰Focus on expense management in the light of the low interest rate environment, and continue to focus on expense control throughout the
Company.
‰Continued disciplined approach to investing and asset/liability management (“ALM”), including significant hedging to protect against low interest
rates and the purchasing of derivatives to protect against higher interest rates.
We expect only modest investment losses in 2013, but more difficult to predict is the impact of potential changes in fair value of freestanding and
embedded derivatives as even relatively small movements in market variables, including interest rates, equity levels and volatility, can have a large impact
on the fair value of derivatives and net derivative gains (losses). Additionally, changes in fair value of embedded derivatives within certain insurance
liabilities may have a material impact on net derivative gains (losses) related to the inclusion of a nonperformance risk adjustment.
As part of an enterprise-wide strategic initiative, by 2016, we expect to increase our operating return on common equity to the low end of the 12% to
14% range, driven by higher operating earnings. If we were to assume no share buybacks through year-end 2016, our estimated operating return on
equity target range for 2016 would be approximately 100 basis points lower than this previously noted range, all other assumptions held constant. We
will leverage our scale to improve the value we provide to customers and shareholders in order to achieve $1 billion in efficiencies, $600 million of which
is expected to be related to net pre-tax expense savings, and $400 million of which we expect to be reinvested in our technology, platforms and
functionality to improve our current operations and develop new capabilities. Additionally, we will shift our product mix toward protection products and
away from more capital-intensive products, in order to generate more predictable operating earnings and cash flows, and improve our risk profile and
free cash flow. We expect that by 2016, more than 20% of our operating earnings will come from emerging markets.
Impact of Superstorm Sandy
On October 29, 2012, Superstorm Sandy made landfall in the Northeastern United States causing extensive property damage. MetLife’s property &
casualty business’ gross losses from Superstorm Sandy were approximately $150 million, before income tax. As of December 31, 2012, we recognized
total net losses related to the catastrophe of $90 million, net of income tax and reinsurance recoverables and including reinstatement premiums, which
impacted the Retail and Group, Voluntary & Worksite Benefits segments. The Retail and Group, Voluntary & Worksite Benefits segments recorded net
losses related to the catastrophe of $49 million and $41 million, each net of income tax reinsurance recoverables and reinstatement premiums,
respectively.
Additional storm-related losses may be recorded in future periods as claims are received from insureds and claims to reinsurers are processed.
Reinsurance recoveries are dependent on the continued creditworthiness of the reinsurers, which may be affected by their other reinsured losses in
connection with Superstorm Sandy and otherwise.
MetLife, Inc. 7