MetLife 2012 Annual Report Download - page 89
Download and view the complete annual report
Please find page 89 of the 2012 MetLife annual report below. You can navigate through the pages in the report by either clicking on the pages listed below, or by using the keyword search tool below to find specific information within the annual report.-
 1
1 -
2
-
3
-
4
-
5
-
6
-
7
-
8
-
9
-
10
-
11
-
12
-
13
-
14
-
15
-
16
-
17
-
18
-
19
-
20
-
21
-
22
-
23
-
24
-
25
-
26
-
27
-
28
-
29
-
30
-
31
-
32
-
33
-
34
-
35
-
36
-
37
-
38
-
39
-
40
-
41
-
42
-
43
-
44
-
45
-
46
-
47
-
48
-
49
-
50
-
51
-
52
-
53
-
54
-
55
-
56
-
57
-
58
-
59
-
60
-
61
-
62
-
63
-
64
-
65
-
66
-
67
-
68
-
69
-
70
-
71
-
72
-
73
-
74
-
75
-
76
-
77
-
78
-
 79
79 -
 80
80 -
 81
81 -
 82
82 -
 83
83 -
 84
84 -
 85
85 -
 86
86 -
 87
87 -
 88
88 -
 89
89 -
 90
90 -
 91
91 -
 92
92 -
 93
93 -
 94
94 -
 95
95 -
 96
96 -
 97
97 -
 98
98 -
 99
99 -
100
-
101
-
102
-
103
-
104
-
105
-
106
-
107
-
108
-
109
-
110
-
111
-
112
-
113
-
114
-
115
-
116
-
117
-
118
-
119
-
120
-
121
-
122
-
123
-
124
-
125
-
126
-
127
-
128
-
129
-
130
-
131
-
132
-
133
-
134
-
135
-
136
-
137
-
138
-
139
-
140
-
141
-
142
-
143
-
144
-
145
-
146
-
147
-
148
-
149
-
150
-
151
-
152
-
153
-
154
-
155
-
156
-
157
-
158
-
159
-
160
-
161
-
162
-
163
-
164
-
165
-
166
-
167
-
168
-
169
-
170
-
171
-
172
-
173
-
174
-
175
-
176
-
177
-
178
-
179
-
180
-
181
-
182
-
183
-
184
-
185
-
186
-
187
-
188
-
189
-
190
-
191
-
192
-
193
-
194
-
195
-
196
-
197
-
198
-
199
-
200
-
201
-
202
-
203
-
204
-
205
-
206
-
207
-
208
-
209
-
210
-
211
-
212
-
213
-
214
-
215
 |
 |

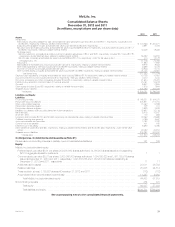
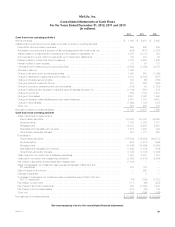
MetLife, Inc.
Consolidated Statements of Cash Flows
For the Years Ended December 31, 2012, 2011 and 2010
(In millions)
2012 2011 2010
Cash flows from operating activities
Net income (loss) ......................................................................... $ 1,362 $ 6,415 $ 2,663
Adjustments to reconcile net income (loss) to net cash provided by operating activities:
Depreciation and amortization expenses ...................................................... 596 679 585
Amortization of premiums and accretion of discounts associated with investments, net ................. (426) (477) (1,078)
(Gains) losses on investments and derivatives and from sales of businesses, net ...................... 3,197 (3,181) 854
(Income) loss from equity method investments, net of dividends or distributions ....................... 108 315 48
Interest credited to policyholder account balances .............................................. 7,729 5,603 4,925
Interest credited to bank deposits ........................................................... 78 95 137
Universal life and investment-type product policy fees ........................................... (8,556) (7,806) (6,037)
Goodwill impairment ..................................................................... 1,868 — —
Change in fair value option and trading securities ............................................... 1,900 648 (1,369)
Change in residential mortgage loans held-for-sale, net .......................................... 3,370 (4,530) (487)
Change in mortgage servicing rights ......................................................... 153 (60) (165)
Change in accrued investment income ....................................................... 219 525 (206)
Change in premiums, reinsurance and other receivables ......................................... (109) 58 (1,023)
Change in deferred policy acquisition costs and value of business acquired, net ...................... (1,139) (591) (370)
Change in income tax .................................................................... (883) 1,742 1,231
Change in other assets ................................................................... 2,951 2,360 1,948
Change in insurance-related liabilities and policy-related balances .................................. 5,918 7,081 6,491
Change in other liabilities .................................................................. (1,699) 1,136 (315)
Other, net ............................................................................. 523 261 153
Net cash provided by operating activities ....................................................... 17,160 10,273 7,985
Cash flows from investing activities
Sales, maturities and repayments of:
Fixed maturity securities ................................................................. 103,823 104,302 86,529
Equity securities ....................................................................... 1,140 2,006 1,371
Mortgage loans ....................................................................... 14,673 13,486 6,361
Real estate and real estate joint ventures ................................................... 1,018 1,296 322
Other limited partnership interests ......................................................... 974 1,121 522
Purchases of:
Fixed maturity securities ................................................................. (115,793) (116,939) (100,713)
Equity securities ....................................................................... (627) (1,481) (949)
Mortgage loans ....................................................................... (11,442) (14,694) (8,967)
Real estate and real estate joint ventures ................................................... (1,942) (1,534) (786)
Other limited partnership interests ......................................................... (1,323) (1,147) (1,008)
Cash received in connection with freestanding derivatives ........................................ 1,933 2,815 1,814
Cash paid in connection with freestanding derivatives ........................................... (3,258) (3,478) (2,548)
Net change in securitized reverse residential mortgage loans ...................................... (1,198) — —
Sales of businesses, net of cash and cash equivalents disposed of $29, $54 and
$0, respectively ....................................................................... 576 126 —
Sale of interest in joint venture .............................................................. — 265 —
Disposal of subsidiary .................................................................... — 4 —
Purchases of businesses, net of cash and cash equivalents acquired of $33, $70 and
$4,175, respectively ................................................................... (16) (163) (3,021)
Net change in policy loans ................................................................ (111) (66) (225)
Net change in short-term investments ........................................................ 593 (7,949) 3,033
Net change in other invested assets ......................................................... (791) (19) 148
Other, net ............................................................................. (158) (169) (186)
Net cash used in investing activities ........................................................... $ (11,929) $ (22,218) $ (18,303)
See accompanying notes to the consolidated financial statements.
MetLife, Inc. 83