MetLife 2012 Annual Report Download - page 105
Download and view the complete annual report
Please find page 105 of the 2012 MetLife annual report below. You can navigate through the pages in the report by either clicking on the pages listed below, or by using the keyword search tool below to find specific information within the annual report.-
 1
1 -
2
-
3
-
4
-
5
-
6
-
7
-
8
-
9
-
10
-
11
-
12
-
13
-
14
-
15
-
16
-
17
-
18
-
19
-
20
-
21
-
22
-
23
-
24
-
25
-
26
-
27
-
28
-
29
-
30
-
31
-
32
-
33
-
34
-
35
-
36
-
37
-
38
-
39
-
40
-
41
-
42
-
43
-
44
-
45
-
46
-
47
-
48
-
49
-
50
-
51
-
52
-
53
-
54
-
55
-
56
-
57
-
58
-
59
-
60
-
61
-
62
-
63
-
64
-
65
-
66
-
67
-
68
-
69
-
70
-
71
-
72
-
73
-
74
-
75
-
76
-
77
-
78
-
79
-
80
-
81
-
82
-
83
-
84
-
85
-
86
-
87
-
88
-
89
-
90
-
91
-
92
-
93
-
94
-
 95
95 -
 96
96 -
 97
97 -
 98
98 -
 99
99 -
 100
100 -
 101
101 -
 102
102 -
 103
103 -
 104
104 -
 105
105 -
 106
106 -
 107
107 -
 108
108 -
 109
109 -
 110
110 -
 111
111 -
 112
112 -
 113
113 -
 114
114 -
 115
115 -
116
-
117
-
118
-
119
-
120
-
121
-
122
-
123
-
124
-
125
-
126
-
127
-
128
-
129
-
130
-
131
-
132
-
133
-
134
-
135
-
136
-
137
-
138
-
139
-
140
-
141
-
142
-
143
-
144
-
145
-
146
-
147
-
148
-
149
-
150
-
151
-
152
-
153
-
154
-
155
-
156
-
157
-
158
-
159
-
160
-
161
-
162
-
163
-
164
-
165
-
166
-
167
-
168
-
169
-
170
-
171
-
172
-
173
-
174
-
175
-
176
-
177
-
178
-
179
-
180
-
181
-
182
-
183
-
184
-
185
-
186
-
187
-
188
-
189
-
190
-
191
-
192
-
193
-
194
-
195
-
196
-
197
-
198
-
199
-
200
-
201
-
202
-
203
-
204
-
205
-
206
-
207
-
208
-
209
-
210
-
211
-
212
-
213
-
214
-
215
 |
 |

MetLife, Inc.
Notes to the Consolidated Financial Statements — (Continued)
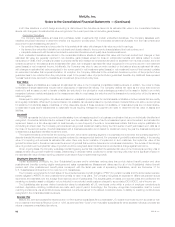
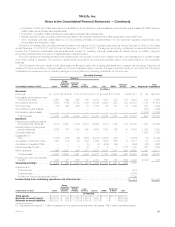
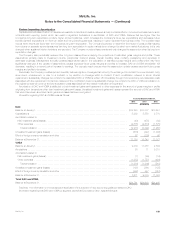
Operating Earnings
Americas
Year Ended
December 31, 2010 Retail
Group,
Voluntary
& Worksite
Benefits
Corporate
Benefit
Funding Latin
America Total Asia EMEA Corporate
& Other Total Adjustments Total
Consolidated
(In millions)
Revenues
Premiums ............ $ 6,491 $14,100 $2,345 $1,969 $24,905 $1,716 $ 439 $ 11 $27,071 $ — $27,071
Universal life and
investment-type
product policy fees . . . 3,655 616 226 630 5,127 502 50 138 5,817 211 6,028
Net investment
income ............ 7,644 1,702 5,280 927 15,553 497 155 650 16,855 638 17,493
Other revenues ........ 633 369 247 12 1,261 14 9 109 1,393 935 2,328
Net investment gains
(losses) ............ — — — — — — — — — (408) (408)
Net derivative gains
(losses) ............ — — — — — — — — — (265) (265)
Total revenues ...... 18,423 16,787 8,098 3,538 46,846 2,729 653 908 51,136 1,111 52,247
Expenses
Policyholder benefits and
claims and
policyholder
dividends .......... 8,835 13,112 4,677 1,829 28,453 1,351 137 33 29,974 698 30,672
Interest credited to
policyholder account
balances ........... 2,381 192 1,447 370 4,390 183 124 — 4,697 222 4,919
Goodwill impairment .... — — — — — — — — — — —
Capitalization of DAC . . . (1,769) (187) (18) (221) (2,195) (459) (116) — (2,770) — (2,770)
Amortization of DAC and
VOBA ............. 1,724 181 16 144 2,065 290 87 1 2,443 34 2,477
Amortization of negative
VOBA ............. — — — (1) (1) (49) (7) — (57) (7) (64)
Interest expense on
debt .............. 2 — 8 1 11 1 1 1,124 1,137 413 1,550
Other expenses ....... 5,059 2,193 494 901 8,647 1,142 434 379 10,602 1,132 11,734
Total expenses ...... 16,232 15,491 6,624 3,023 41,370 2,459 660 1,537 46,026 2,492 48,518
Provision for income tax
expense (benefit) .... 735 427 516 92 1,770 46 — (402) 1,414 (304) 1,110
Operating earnings .. $ 1,456 $ 869 $ 958 $ 423 $ 3,706 $ 224 $ (7) $ (227) 3,696
Adjustments to:
Total revenues .......................................................................... 1,111
Total expenses .......................................................................... (2,492)
Provision for income tax (expense) benefit ..................................................... 304
Income (loss) from continuing operations, net of income tax ................................. $ 2,619 $ 2,619
Net investment income is based upon the actual results of each segment’s specifically identifiable investment portfolio adjusted for allocated equity.
Other costs are allocated to each of the segments based upon: (i) a review of the nature of such costs; (ii) time studies analyzing the amount of
employee compensation costs incurred by each segment; and (iii) cost estimates included in the Company’s product pricing.
The following table presents total premiums, universal life and investment-type product policy fees and other revenues by major product groups of
the Company’s segments as well as Corporate & Other:
MetLife, Inc. 99