MetLife 2012 Annual Report Download - page 125
Download and view the complete annual report
Please find page 125 of the 2012 MetLife annual report below. You can navigate through the pages in the report by either clicking on the pages listed below, or by using the keyword search tool below to find specific information within the annual report.
MetLife, Inc.
Notes to the Consolidated Financial Statements — (Continued)
Mortgage Loans
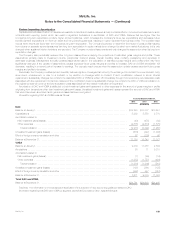
Mortgage Loans Held-for-Investment and Held-for-Sale by Portfolio Segment
Mortgage loans are summarized as follows at:
December 31,
2012 2011
Carrying % of Carrying % of
Value Total Value Total
(In millions)
Mortgage loans held-for-investment:
Commercial ............................................................................ $40,472 71.0% $ 40,440 56.1%
Agricultural ............................................................................. 12,843 22.5 13,129 18.2
Residential (1) ........................................................................... 958 1.7 689 1.0
Subtotal (2) ........................................................................... 54,273 95.2 54,258 75.3
Valuation allowances (1) ................................................................... (347) (0.6) (481) (0.7)
Subtotal mortgage loans held-for-investment, net ............................................. 53,926 94.6 53,777 74.6
Commercial mortgage loans held by CSEs .................................................... 2,666 4.7 3,138 4.4
Total mortgage loans held-for-investment, net .............................................. 56,592 99.3 56,915 79.0
Mortgage loans held-for-sale:
Residential — FVO (1) .................................................................... 49 0.1 3,064 4.2
Mortgage loans — lower of amortized cost or estimated fair value (1) ................................ 365 0.6 4,462 6.2
Securitized reverse residential mortgage loans (1), (3) ............................................ — — 7,652 10.6
Total mortgage loans held-for-sale ....................................................... 414 0.7 15,178 21.0
Total mortgage loans, net ............................................................ $57,006 100.0% $ 72,093 100.0%
(1) As a result of the MetLife Bank Divestiture described in Note 3, the Company has disposed of certain mortgage loans and de-recognized its
securitized reverse residential mortgage loans.
(2) Purchases of mortgage loans were $205 million and $64 million for the years ended December 31, 2012 and 2011, respectively.
(3) See Note 1 for a discussion of securitized reverse residential mortgage loans.
See “— Variable Interest Entities” for discussion of CSEs included in the table above.
Mortgage Loans and Valuation Allowance by Portfolio Segment
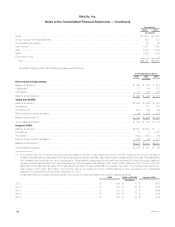
The carrying value prior to valuation allowance (“recorded investment”) in mortgage loans held-for-investment, by portfolio segment, by method of
evaluation of credit loss, and the related valuation allowances, by type of credit loss, were as follows:
December 31,
2012 2011
Commercial Agricultural Residential Total Commercial Agricultural Residential Total
(In millions)
Mortgage loans:
Evaluated individually for credit losses ........ $ 539 $ 181 $ 13 $ 733 $ 96 $ 159 $ 13 $ 268
Evaluated collectively for credit losses ........ 39,933 12,662 945 53,540 40,344 12,970 676 53,990
Total mortgage loans .................... 40,472 12,843 958 54,273 40,440 13,129 689 54,258
Valuation allowances:
Specific credit losses ..................... 94 21 2 117 59 45 1 105
Non-specifically identified credit losses ....... 199 31 — 230 339 36 1 376
Total valuation allowances ................ 293 52 2 347 398 81 2 481
Mortgage loans, net of valuation
allowance ........................... $40,179 $12,791 $956 $53,926 $40,042 $13,048 $687 $53,777
Valuation Allowance Rollforward by Portfolio Segment
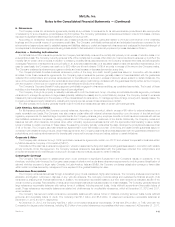
The changes in the valuation allowance, by portfolio segment, were as follows:
Commercial Agricultural Residential Total
(In millions)
Balance at January 1, 2010 ................................................. $589 $115 $ 17 $ 721
Provision (release) ......................................................... (5) 12 2 9
Charge-offs, net of recoveries ................................................ (22) (39) (5) (66)
Balance at December 31, 2010 .............................................. 562 88 14 664
Provision (release) ......................................................... (152) (3) 10 (145)
Charge-offs, net of recoveries ................................................ (12) (4) (3) (19)
Transfer to held-for-sale (1) .................................................. — — (19) (19)
Balance at December 31, 2011 .............................................. 398 81 2 481
Provision (release) ......................................................... (92) — 6 (86)
Charge-offs, net of recoveries ................................................ (13) (24) — (37)
Transfer to held-for-sale (1) .................................................. — (5) (6) (11)
Balance at December 31, 2012 .............................................. $293 $ 52 $ 2 $347
(1) The valuation allowance on and the related carrying value of certain residential mortgage loans held-for-investment were transferred to mortgage
loans held-for-sale in connection with the MetLife Bank Divestiture. See Note 3.
MetLife, Inc. 119


