MetLife 2012 Annual Report Download - page 166
Download and view the complete annual report
Please find page 166 of the 2012 MetLife annual report below. You can navigate through the pages in the report by either clicking on the pages listed below, or by using the keyword search tool below to find specific information within the annual report.-
 1
1 -
2
-
3
-
4
-
5
-
6
-
7
-
8
-
9
-
10
-
11
-
12
-
13
-
14
-
15
-
16
-
17
-
18
-
19
-
20
-
21
-
22
-
23
-
24
-
25
-
26
-
27
-
28
-
29
-
30
-
31
-
32
-
33
-
34
-
35
-
36
-
37
-
38
-
39
-
40
-
41
-
42
-
43
-
44
-
45
-
46
-
47
-
48
-
49
-
50
-
51
-
52
-
53
-
54
-
55
-
56
-
57
-
58
-
59
-
60
-
61
-
62
-
63
-
64
-
65
-
66
-
67
-
68
-
69
-
70
-
71
-
72
-
73
-
74
-
75
-
76
-
77
-
78
-
79
-
80
-
81
-
82
-
83
-
84
-
85
-
86
-
87
-
88
-
89
-
90
-
91
-
92
-
93
-
94
-
95
-
96
-
97
-
98
-
99
-
100
-
101
-
102
-
103
-
104
-
105
-
106
-
107
-
108
-
109
-
110
-
111
-
112
-
113
-
114
-
115
-
116
-
117
-
118
-
119
-
120
-
121
-
122
-
123
-
124
-
125
-
126
-
127
-
128
-
129
-
130
-
131
-
132
-
133
-
134
-
135
-
136
-
137
-
138
-
139
-
140
-
141
-
142
-
143
-
144
-
145
-
146
-
147
-
148
-
149
-
150
-
151
-
152
-
153
-
154
-
155
-
 156
156 -
 157
157 -
 158
158 -
 159
159 -
 160
160 -
 161
161 -
 162
162 -
 163
163 -
 164
164 -
 165
165 -
 166
166 -
 167
167 -
 168
168 -
 169
169 -
 170
170 -
 171
171 -
 172
172 -
 173
173 -
 174
174 -
 175
175 -
 176
176 -
177
-
178
-
179
-
180
-
181
-
182
-
183
-
184
-
185
-
186
-
187
-
188
-
189
-
190
-
191
-
192
-
193
-
194
-
195
-
196
-
197
-
198
-
199
-
200
-
201
-
202
-
203
-
204
-
205
-
206
-
207
-
208
-
209
-
210
-
211
-
212
-
213
-
214
-
215
 |
 |

MetLife, Inc.
Notes to the Consolidated Financial Statements — (Continued)
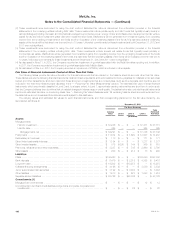
(2) These investments were accounted for using the cost method. Estimated fair value is determined from information provided in the financial
statements of the underlying entities including NAV data. These investments include private equity and debt funds that typically invest primarily in
various strategies including domestic and international leveraged buyout funds; power, energy, timber and infrastructure development funds; venture
capital funds; and below investment grade debt and mezzanine debt funds. Distributions will be generated from investment gains, from operating
income from the underlying investments of the funds and from liquidation of the underlying assets of the funds. It is estimated that the underlying
assets of the funds will be liquidated over the next two to 10 years. Unfunded commitments for these investments at both December 31, 2012 and
2011 were not significant.
(3) These investments were accounted for using the cost method. Estimated fair value is determined from information provided in the financial
statements of the underlying entities including NAV data. These investments include several real estate funds that typically invest primarily in
commercial real estate. Distributions will be generated from investment gains, from operating income from the underlying investments of the funds
and from liquidation of the underlying assets of the funds. It is estimated that the underlying assets of the funds will be liquidated over the next two to
10 years. Unfunded commitments for these investments at both December 31, 2012 and 2011 were not significant.
(4) As discussed in Note 11, in 2012, the Company recorded an impairment of goodwill associated with the Retail Annuities reporting unit. In addition,
in 2011, the Company recorded an impairment of goodwill associated with MetLife Bank.
(5) As discussed in Note 5, in 2012, the Company recorded an impairment of VOCRA, which is included in other assets.
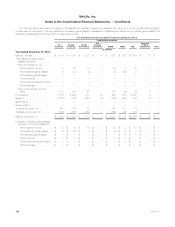
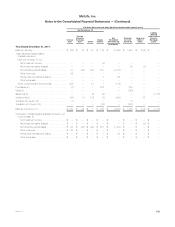
Fair Value of Financial Instruments Carried at Other Than Fair Value
The following tables provide fair value information for financial instruments that are carried on the balance sheet at amounts other than fair value.
These tables exclude the following financial instruments: cash and cash equivalents, accrued investment income, payables for collateral under securities
loaned and other transactions, short-term debt and those short-term investments that are not securities, such as time deposits, and therefore are not
included in the three level hierarchy table disclosed in the “— Recurring Fair Value Measurements” section. The estimated fair value of these financial
instruments, which are primarily classified in Level 2 and, to a lesser extent, in Level 1, approximate carrying value as they are short-term in nature such
that the Company believes there is minimal risk of material changes in interest rates or credit quality. The tables below also exclude financial instruments
reported at estimated fair value on a recurring basis. See “—Recurring Fair Value Measurements.” All remaining balance sheet amounts excluded from
the table below are not considered financial instruments subject to this disclosure.
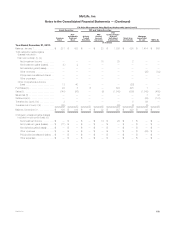
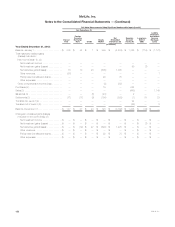
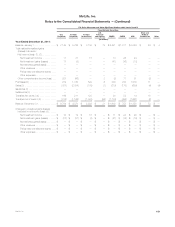
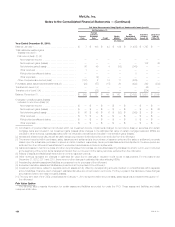
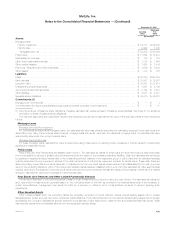
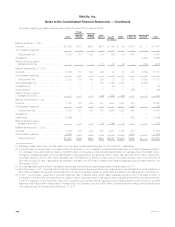
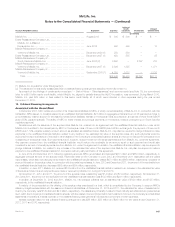
The carrying values and estimated fair values for such financial instruments, and their corresponding placement in the fair value hierarchy, are
summarized as follows at:
December 31, 2012
Fair Value Hierarchy
Carrying
Value Level 1 Level 2 Level 3
Total
Estimated
Fair Value
(In millions)
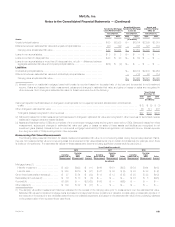
Assets:
Mortgage loans:
Held-for-investment ....................................................... $ 53,926 $ — $ — $ 57,381 $ 57,381
Held-for-sale ............................................................ 365 — — 365 365
Mortgage loans, net ..................................................... $ 54,291 $ — $ — $ 57,746 $ 57,746
Policy loans ............................................................... $ 11,884 $ — $ 1,690 $ 12,567 $ 14,257
Real estate joint ventures .................................................... $ 113 $ — $ — $ 171 $ 171
Other limited partnership interests .............................................. $ 1,154 $ — $ — $ 1,277 $ 1,277
Other invested assets ....................................................... $ 815 $305 $ 144 $ 366 $ 815
Premiums, reinsurance and other receivables ..................................... $ 3,287 $ — $ 745 $ 2,960 $ 3,705
Other assets .............................................................. $ 260 $ — $ 214 $ 78 $ 292
Liabilities:
PABs .................................................................... $149,928 $ — $ — $158,040 $158,040
Bank deposits ............................................................. $ 6,416 $ — $ 2,018 $ 4,398 $ 6,416
Long-term debt ............................................................ $ 16,502 $ — $18,978 $ — $ 18,978
Collateral financing arrangements .............................................. $ 4,196 $ — $ — $ 3,839 $ 3,839
Junior subordinated debt securities ............................................ $ 3,192 $ — $ 3,984 $ — $ 3,984
Other liabilities ............................................................. $ 1,913 $ — $ 673 $ 1,243 $ 1,916
Separate account liabilities ................................................... $ 58,726 $ — $58,726 $ — $ 58,726
Commitments: (1)
Mortgage loan commitments ................................................. $ — $ — $ — $ 12 $ 12
Commitments to fund bank credit facilities, bridge loans and private corporate bond
investments ............................................................. $ — $ — $ 22 $ — $ 22
160 MetLife, Inc.