MetLife 2012 Annual Report Download - page 111
Download and view the complete annual report
Please find page 111 of the 2012 MetLife annual report below. You can navigate through the pages in the report by either clicking on the pages listed below, or by using the keyword search tool below to find specific information within the annual report.-
 1
1 -
2
-
3
-
4
-
5
-
6
-
7
-
8
-
9
-
10
-
11
-
12
-
13
-
14
-
15
-
16
-
17
-
18
-
19
-
20
-
21
-
22
-
23
-
24
-
25
-
26
-
27
-
28
-
29
-
30
-
31
-
32
-
33
-
34
-
35
-
36
-
37
-
38
-
39
-
40
-
41
-
42
-
43
-
44
-
45
-
46
-
47
-
48
-
49
-
50
-
51
-
52
-
53
-
54
-
55
-
56
-
57
-
58
-
59
-
60
-
61
-
62
-
63
-
64
-
65
-
66
-
67
-
68
-
69
-
70
-
71
-
72
-
73
-
74
-
75
-
76
-
77
-
78
-
79
-
80
-
81
-
82
-
83
-
84
-
85
-
86
-
87
-
88
-
89
-
90
-
91
-
92
-
93
-
94
-
95
-
96
-
97
-
98
-
99
-
100
-
 101
101 -
 102
102 -
 103
103 -
 104
104 -
 105
105 -
 106
106 -
 107
107 -
 108
108 -
 109
109 -
 110
110 -
 111
111 -
 112
112 -
 113
113 -
 114
114 -
 115
115 -
 116
116 -
 117
117 -
 118
118 -
 119
119 -
 120
120 -
 121
121 -
122
-
123
-
124
-
125
-
126
-
127
-
128
-
129
-
130
-
131
-
132
-
133
-
134
-
135
-
136
-
137
-
138
-
139
-
140
-
141
-
142
-
143
-
144
-
145
-
146
-
147
-
148
-
149
-
150
-
151
-
152
-
153
-
154
-
155
-
156
-
157
-
158
-
159
-
160
-
161
-
162
-
163
-
164
-
165
-
166
-
167
-
168
-
169
-
170
-
171
-
172
-
173
-
174
-
175
-
176
-
177
-
178
-
179
-
180
-
181
-
182
-
183
-
184
-
185
-
186
-
187
-
188
-
189
-
190
-
191
-
192
-
193
-
194
-
195
-
196
-
197
-
198
-
199
-
200
-
201
-
202
-
203
-
204
-
205
-
206
-
207
-
208
-
209
-
210
-
211
-
212
-
213
-
214
-
215
 |
 |

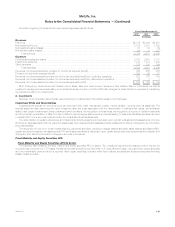
MetLife, Inc.
Notes to the Consolidated Financial Statements — (Continued)
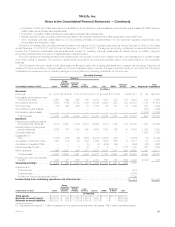
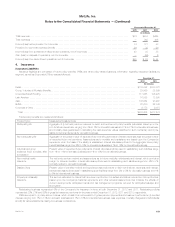
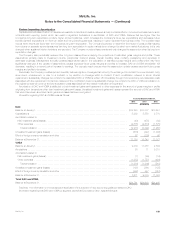
Annuity Contracts Universal and Variable
Life Contracts
GMDB GMIB Secondary
Guarantees Paid-Up
Guarantees Total
(In millions)
Direct and Assumed
Balance at January 1, 2010 ................................... $168 $ 402 $ 504 $174 $1,248
Acquisitions ................................................ 46 110 2,952 — 3,108
Incurred guaranteed benefits ................................... 149 111 536 24 820
Paid guaranteed benefits ...................................... (91) — (1) — (92)
Balance at December 31, 2010 ................................ 272 623 3,991 198 5,084
Incurred guaranteed benefits ................................... 273 269 496 23 1,061
Paid guaranteed benefits ...................................... (113) (10) (24) — (147)
Balance at December 31, 2011 ................................ 432 882 4,463 221 5,998
Incurred guaranteed benefits ................................... 252 771 348 25 1,396
Paid guaranteed benefits ...................................... (117) (18) (26) — (161)
Balance at December 31, 2012 ................................ $567 $1,635 $4,785 $246 $7,233
Ceded
Balance at January 1, 2010 ................................... $ 6 $ — $ 182 $122 $ 310
Acquisitions ................................................ 30 — — — 30
Incurred guaranteed benefits ................................... 18 (1) 412 17 446
Paid guaranteed benefits ...................................... (15) — — — (15)
Balance at December 31, 2010 ................................ 39 (1) 594 139 771
Incurred guaranteed benefits ................................... 35 9 20 16 80
Paid guaranteed benefits ...................................... (20) — — — (20)
Balance at December 31, 2011 ................................ 54 8 614 155 831
Incurred guaranteed benefits ................................... 22 1 139 18 180
Paid guaranteed benefits ...................................... (20) — — — (20)
Balance at December 31, 2012 ................................ $ 56 $ 9 $ 753 $173 $ 991
Net
Balance at January 1, 2010 ................................... $162 $ 402 $ 322 $ 52 $ 938
Acquisitions ................................................ 16 110 2,952 — 3,078
Incurred guaranteed benefits ................................... 131 112 124 7 374
Paid guaranteed benefits ...................................... (76) — (1) — (77)
Balance at December 31, 2010 ................................ 233 624 3,397 59 4,313
Incurred guaranteed benefits ................................... 238 260 476 7 981
Paid guaranteed benefits ...................................... (93) (10) (24) — (127)
Balance at December 31, 2011 ................................ 378 874 3,849 66 5,167
Incurred guaranteed benefits ................................... 230 770 209 7 1,216
Paid guaranteed benefits ...................................... (97) (18) (26) — (141)
Balance at December 31, 2012 ................................ $511 $1,626 $4,032 $ 73 $6,242
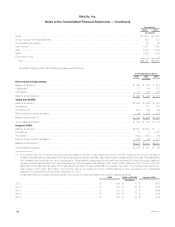
Account balances of contracts with insurance guarantees were invested in separate account asset classes as follows at:
December 31,
2012 2011
(In millions)
Fund Groupings:
Balanced ........................................................................................... $ 67,230 $ 52,823
Equity .............................................................................................. 64,209 57,750
Bond ............................................................................................... 11,188 9,838
Specialty ............................................................................................ 2,260 2,034
Money Market ........................................................................................ 1,291 1,521
Total ............................................................................................. $146,178 $123,966
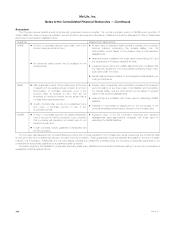
Based on the type of guarantee, the Company defines net amount at risk (“NAR”) as listed below. These amounts include direct and assumed
business, but exclude offsets from hedging or reinsurance, if any.
MetLife, Inc. 105