MetLife 2012 Annual Report Download - page 41
Download and view the complete annual report
Please find page 41 of the 2012 MetLife annual report below. You can navigate through the pages in the report by either clicking on the pages listed below, or by using the keyword search tool below to find specific information within the annual report.-
 1
1 -
2
-
3
-
4
-
5
-
6
-
7
-
8
-
9
-
10
-
11
-
12
-
13
-
14
-
15
-
16
-
17
-
18
-
19
-
20
-
21
-
22
-
23
-
24
-
25
-
26
-
27
-
28
-
29
-
30
-
 31
31 -
 32
32 -
 33
33 -
 34
34 -
 35
35 -
 36
36 -
 37
37 -
 38
38 -
 39
39 -
 40
40 -
 41
41 -
 42
42 -
 43
43 -
 44
44 -
 45
45 -
 46
46 -
 47
47 -
 48
48 -
 49
49 -
 50
50 -
 51
51 -
52
-
53
-
54
-
55
-
56
-
57
-
58
-
59
-
60
-
61
-
62
-
63
-
64
-
65
-
66
-
67
-
68
-
69
-
70
-
71
-
72
-
73
-
74
-
75
-
76
-
77
-
78
-
79
-
80
-
81
-
82
-
83
-
84
-
85
-
86
-
87
-
88
-
89
-
90
-
91
-
92
-
93
-
94
-
95
-
96
-
97
-
98
-
99
-
100
-
101
-
102
-
103
-
104
-
105
-
106
-
107
-
108
-
109
-
110
-
111
-
112
-
113
-
114
-
115
-
116
-
117
-
118
-
119
-
120
-
121
-
122
-
123
-
124
-
125
-
126
-
127
-
128
-
129
-
130
-
131
-
132
-
133
-
134
-
135
-
136
-
137
-
138
-
139
-
140
-
141
-
142
-
143
-
144
-
145
-
146
-
147
-
148
-
149
-
150
-
151
-
152
-
153
-
154
-
155
-
156
-
157
-
158
-
159
-
160
-
161
-
162
-
163
-
164
-
165
-
166
-
167
-
168
-
169
-
170
-
171
-
172
-
173
-
174
-
175
-
176
-
177
-
178
-
179
-
180
-
181
-
182
-
183
-
184
-
185
-
186
-
187
-
188
-
189
-
190
-
191
-
192
-
193
-
194
-
195
-
196
-
197
-
198
-
199
-
200
-
201
-
202
-
203
-
204
-
205
-
206
-
207
-
208
-
209
-
210
-
211
-
212
-
213
-
214
-
215
 |
 |
We manage investment risk through in-house fundamental credit analysis of the underlying obligors, issuers, transaction structures and real estate
properties. We also manage credit risk, market valuation risk and liquidity risk through industry and issuer diversification and asset allocation. For
commercial real estate and agricultural assets, we manage credit risk and market valuation risk through geographic, property type and product type
diversification and asset allocation. We manage interest rate risk as part of our asset and liability management strategies. These strategies include
maintaining an investment portfolio with diversified maturities that has a weighted average duration that is approximately equal to the duration of our
estimated liability cash flow profile through product design, such as the use of market value adjustment features and surrender charges. We also
manage interest rate risk through proactive monitoring and management of certain non-guaranteed elements of its products, such as the resetting of
credited interest and dividend rates for policies that permit such adjustments. In addition to hedging with foreign currency derivatives, we manage
currency risk by matching much of our foreign currency liabilities in our foreign subsidiaries with their respective foreign currency assets, thereby
reducing our risk to foreign currency exchange rate fluctuation. We also use certain derivatives in the management of credit, interest rate, and equity
market risks.
We use purchased credit default swaps to mitigate credit risk in our investment portfolio. Generally, we purchase credit protection by entering into
credit default swaps referencing the issuers of specific assets we own. In certain cases, basis risk exists between these credit default swaps and the
specific assets we own. For example, we may purchase credit protection on a macro basis to reduce exposure to specific industries or other portfolio
concentrations. In such instances, the referenced entities and obligations under the credit default swaps may not be identical to the individual obligors or
securities in our investment portfolio. In addition, our purchased credit default swaps may have shorter tenors than the underlying investments they are
hedging. However, we dynamically hedge this risk through the rebalancing and rollover of its credit default swaps at their most liquid tenors. We believe
that our purchased credit default swaps serve as effective legal and economic hedges of our credit exposure.
We generally enter into market standard purchased and written credit default swap contracts. Payout under such contracts is triggered by certain
credit events experienced by the referenced entities. For credit default swaps covering North American corporate issuers, credit events typically include
bankruptcy and failure to pay on borrowed money. For European corporate issuers, credit events typically also include involuntary restructuring. With
respect to credit default contracts on Western European sovereign debt, credit events typically include failure to pay debt obligations, repudiation,
moratorium, or involuntary restructuring. In each case, payout on a credit default swap is triggered only after the Credit Derivatives Determinations
Committee of the International Swaps and Derivatives Association deems that a credit event has occurred.
Current Environment
The global economy and markets continue to be affected by significant stress and volatility, which has adversely affected the financial services
sector in particular and global capital markets. As a company with significant operations in the U.S., we are affected by the monetary policy of the
Federal Reserve. The Federal Reserve Board has taken a number of policy actions in recent years to spur economic activity, by keeping interest rates
low and, more recently, through its asset purchase programs. See “— Industry Trends — Impact of Sustained Low Interest Rate Environment” for
information on actions taken by the Federal Reserve Board and central banks around the world to support the economic recovery. See “— Industry
Trends — Financial and Economic Environment” for information on actions taken by Japan’s central government and the Bank of Japan to end deflation
and achieve sustainable economic growth in Japan. The Federal Reserve may take further actions to influence interest rates in the future, which may
have an impact on the pricing levels of risk-bearing investments and may adversely impact the level of product sales.
Europe’s Perimeter Region. During 2012, concerns about the economic conditions, capital markets and the solvency of certain European Union
member states, including Europe’s perimeter region and of financial institutions that have significant direct or indirect exposure to their sovereign debt
continued to create market volatility. This market volatility will likely continue to affect the performance of various asset classes in 2013, and perhaps
longer, until there is an ultimate resolution of these European Union sovereign debt-related concerns. As a result of concerns about the ability of
Europe’s perimeter region, to service its sovereign debt, certain countries have experienced credit ratings downgrades. Despite official financial support
programs for the most stressed governments in Europe’s perimeter region, including the March 2012 exchange of €177 billion of Greece domestic law
sovereign debt with private sector holders in exchange for a package of four new securities issued by Greece and the public sector supported
European Financial Stability Facility, concerns about sovereign debt sustainability has expanded to other European Union member states. As a result, in
late 2011 and early 2012, several other European Union member states have experienced credit ratings downgrades or have had their credit ratings
outlook changed to negative. As summarized below, at December 31, 2012 and 2011, we did not have significant exposure to the sovereign debt of
Europe’s perimeter region. Accordingly, we do not expect such investments to have a material adverse effect on our results of operations or financial
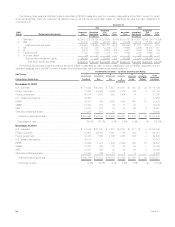
condition. The par value, amortized cost and estimated fair value of holdings in sovereign debt of Europe’s perimeter region were $234 million,
$62 million and $73 million at December 31, 2012, respectively, and $874 million, $254 million and $264 million at December 31, 2011, respectively.
We recorded non-cash impairment charges of $0 and $405 million on our holdings of Greece’s sovereign debt during the years ended December 31,
2012 and 2011, respectively.
European Region Investments. Outside of Europe’s perimeter region, our holdings of sovereign debt, corporate debt and perpetual hybrid securities
in certain European Union member states and other countries in the region that are not members of the European Union (collectively, the “European
Region”) were concentrated in the U.K., Germany, France, the Netherlands, Poland, Norway and Sweden, the sovereign debt of which continues to
maintain the highest credit ratings from all major rating agencies. In the European Region, we have proactively mitigated risk in both direct and indirect
exposures by investing in a diversified portfolio of high quality investments with a focus on the higher-rated countries, reducing our holdings through
sales of financial services securities during 2010 and 2011 and sales of Europe’s perimeter region sovereign debt in 2011, and by purchasing certain
single name credit default protection in 2010 and 2011. Our sales of financial services securities were focused on institutions with exposure to Europe’s
perimeter region, lower preference capital structure instruments, and larger positions. Sovereign debt issued by countries outside of Europe’s perimeter
region comprised $8.9 billion, or 99% of European Region sovereign fixed maturity securities, at estimated fair value at December 31, 2012. The
European Region corporate securities (fixed maturity and perpetual hybrid securities classified as non-redeemable preferred stock) are invested in a
diversified portfolio of primarily non-financial services securities, which comprised $25.0 billion, or 75% of European Region total corporate securities, at
estimated fair value at December 31, 2012. Of these European Region sovereign fixed maturity and corporate securities, 91% were investment grade
and, for the 9% that were below investment grade, the majority were non-financial services corporate securities at December 31, 2012. European
Region financial services corporate securities at estimated fair value were $8.2 billion, including $6.2 billion within the banking sector, with 93% invested
in investment grade rated corporate securities, at December 31, 2012.
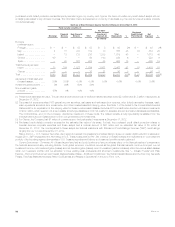
Select European Countries –Investment Exposures. Due to the current level of economic, fiscal and political strain in Europe’s perimeter region
and Cyprus, we continually monitor and adjust our level of investment exposure in these countries. We manage direct and indirect investment exposure
in these countries through fundamental credit analysis. The following table presents a summary of investments by invested asset class and related
MetLife, Inc. 35