MetLife 2012 Annual Report Download - page 196
Download and view the complete annual report
Please find page 196 of the 2012 MetLife annual report below. You can navigate through the pages in the report by either clicking on the pages listed below, or by using the keyword search tool below to find specific information within the annual report.-
 1
1 -
2
-
3
-
4
-
5
-
6
-
7
-
8
-
9
-
10
-
11
-
12
-
13
-
14
-
15
-
16
-
17
-
18
-
19
-
20
-
21
-
22
-
23
-
24
-
25
-
26
-
27
-
28
-
29
-
30
-
31
-
32
-
33
-
34
-
35
-
36
-
37
-
38
-
39
-
40
-
41
-
42
-
43
-
44
-
45
-
46
-
47
-
48
-
49
-
50
-
51
-
52
-
53
-
54
-
55
-
56
-
57
-
58
-
59
-
60
-
61
-
62
-
63
-
64
-
65
-
66
-
67
-
68
-
69
-
70
-
71
-
72
-
73
-
74
-
75
-
76
-
77
-
78
-
79
-
80
-
81
-
82
-
83
-
84
-
85
-
86
-
87
-
88
-
89
-
90
-
91
-
92
-
93
-
94
-
95
-
96
-
97
-
98
-
99
-
100
-
101
-
102
-
103
-
104
-
105
-
106
-
107
-
108
-
109
-
110
-
111
-
112
-
113
-
114
-
115
-
116
-
117
-
118
-
119
-
120
-
121
-
122
-
123
-
124
-
125
-
126
-
127
-
128
-
129
-
130
-
131
-
132
-
133
-
134
-
135
-
136
-
137
-
138
-
139
-
140
-
141
-
142
-
143
-
144
-
145
-
146
-
147
-
148
-
149
-
150
-
151
-
152
-
153
-
154
-
155
-
156
-
157
-
158
-
159
-
160
-
161
-
162
-
163
-
164
-
165
-
166
-
167
-
168
-
169
-
170
-
171
-
172
-
173
-
174
-
175
-
176
-
177
-
178
-
179
-
180
-
181
-
182
-
183
-
184
-
185
-
 186
186 -
 187
187 -
 188
188 -
 189
189 -
 190
190 -
 191
191 -
 192
192 -
 193
193 -
 194
194 -
 195
195 -
 196
196 -
 197
197 -
 198
198 -
 199
199 -
 200
200 -
 201
201 -
 202
202 -
 203
203 -
 204
204 -
 205
205 -
 206
206 -
207
-
208
-
209
-
210
-
211
-
212
-
213
-
214
-
215
 |
 |

MetLife, Inc.
Notes to the Consolidated Financial Statements — (Continued)
(1) Other includes ABS and collateralized mortgage obligations.
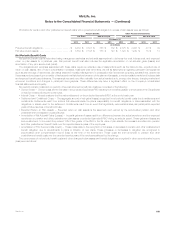
Non-U.S. Plans
Pension benefits are provided utilizing either a traditional formula or cash balance formula, similar to the U.S. plans. The investment objectives are
also similar, subject to local regulations. Generally, these international pension plans invest directly in high quality equity and fixed maturity securities. The
assets of the non-U.S. pension plans are comprised of short-term investments, equity and fixed maturity securities, real estate and hedge fund
investments.
The assets of the non-U.S. pension plans, other than those held in participant directed investment accounts, are managed in accordance with
investment policies consistent with the longer-term nature of related benefit obligations and within prudent risk parameters and consistent with the
policies, goals and derivative instrument risk management guidelines described above for the U.S. plans.
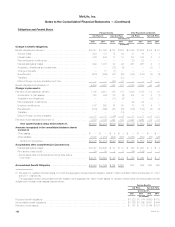
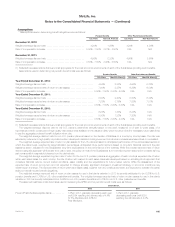
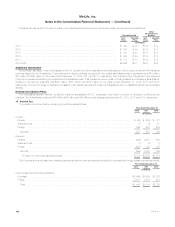
The table below summarizes the actual weighted average allocation of the fair value of total plan assets by asset class at December 31 for the years
indicated and the approved target allocation by major asset class at December 31, 2012 for the plans:
Pension Other Postretirement
Actual Allocation Actual Allocation
Target 2012 2011 Target 2012 2011
Asset Class:
Fixed maturity securities (1) ............................................ 64% 54% 52% 100% 100% 100%
Equity securities (2) .................................................. 17% 24% 23% —% —% —%
Alternative securities (3) ............................................... 19% 22% 25% —% —% —%
Total assets ...................................................... 100% 100% 100% 100%
(1) Fixed maturity securities include foreign bonds.
(2) Equity securities primarily include common stock of non-U.S. companies.
(3) Alternative securities include derivative assets, real estate, short-term investments, and other investments.
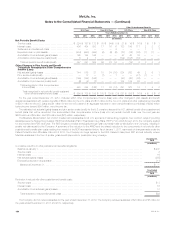
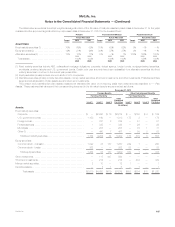
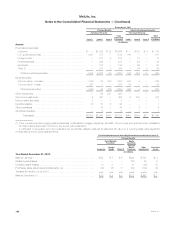
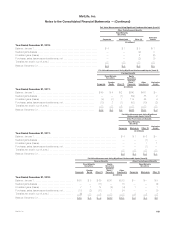
The pension and postretirement plan assets measured at estimated fair value on a recurring basis were determined as described in “— Plan
Assets.” These estimated fair values and their corresponding placement in the fair value hierarchy are summarized as follows:
December 31, 2012
Pension Benefits Other Postretirement Benefits
Fair Value Hierarchy Fair Value Hierarchy
Level 1 Level 2 Level 3
Total
Estimated
Fair Value Level 1 Level 2 Level 3
Total
Estimated
Fair Value
(In millions)
Assets:
Fixed maturity securities:
Foreign bonds ............................................. $— $120 $— $120 $— $15 $— $15
Equity securities:
Common stock - foreign — 54 — 54 — — — —
Other investments ............................................ 24 — — 24 — — — —
Derivative assets ............................................. — — 13 13 — — — —
Real estate ................................................. — — 7 7 — — — —
Short-term investments ........................................ — 6 — 6 — — — —
Total assets ........................................... $24 $180 $20 $224 $— $15 $— $15
190 MetLife, Inc.